| By Gale Staff |
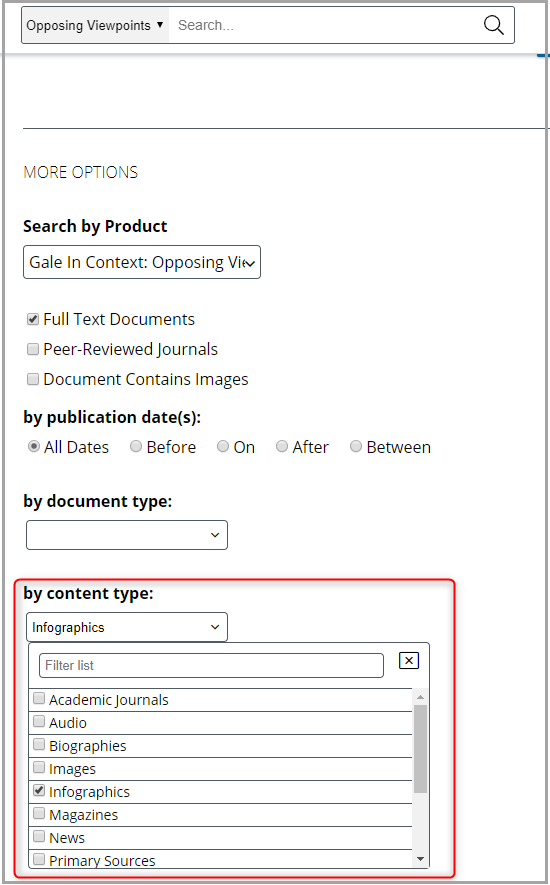
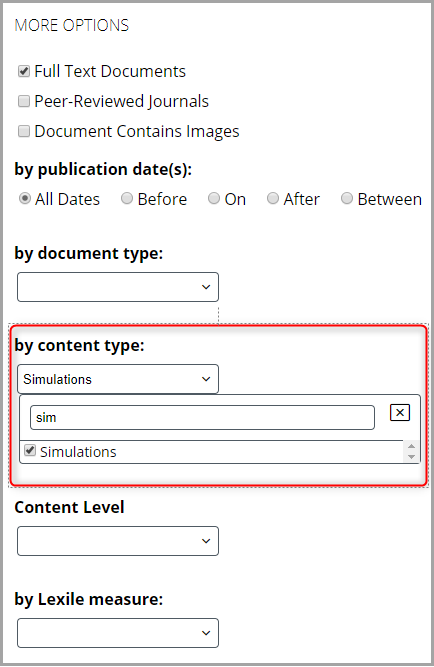
Interactive visual content can be an important component for learning, and we’ve just made it easier to find that content in Gale In Context: Opposing Viewpoints and Gale In Context: Science. Over 675 infographics in Opposing Viewpoints and over 325 simulations in Science have been placed into their own content “buckets,” making them more visible on portal pages and in search results, as well as providing a clear way to search for infographics and simulations.
Here’s where you’ll find infographics in Opposing Viewpoints on a topic portal page:

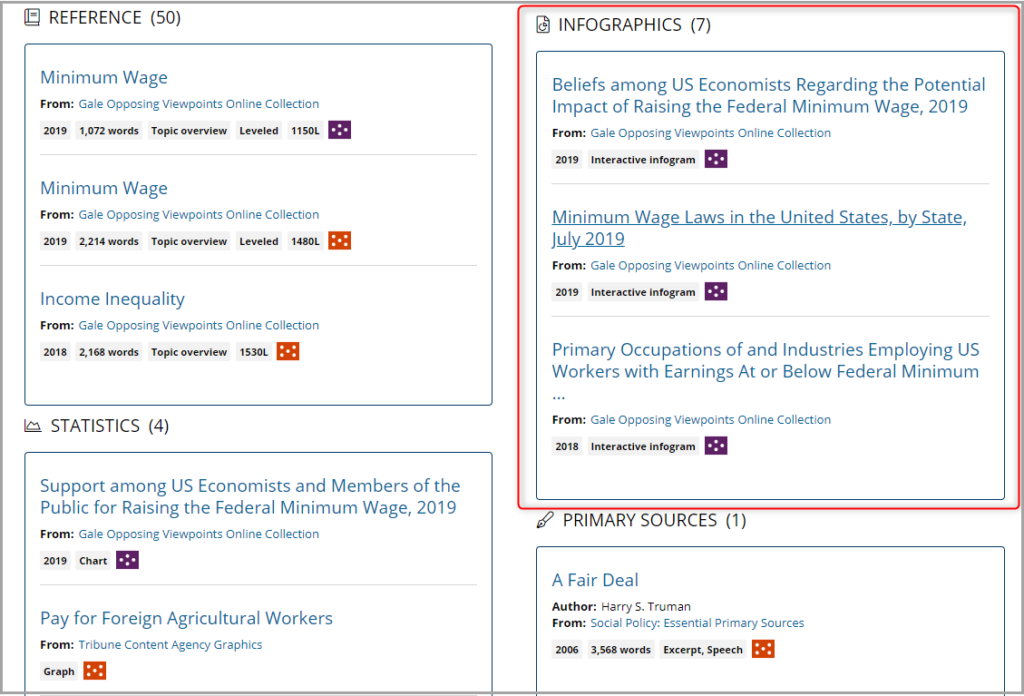
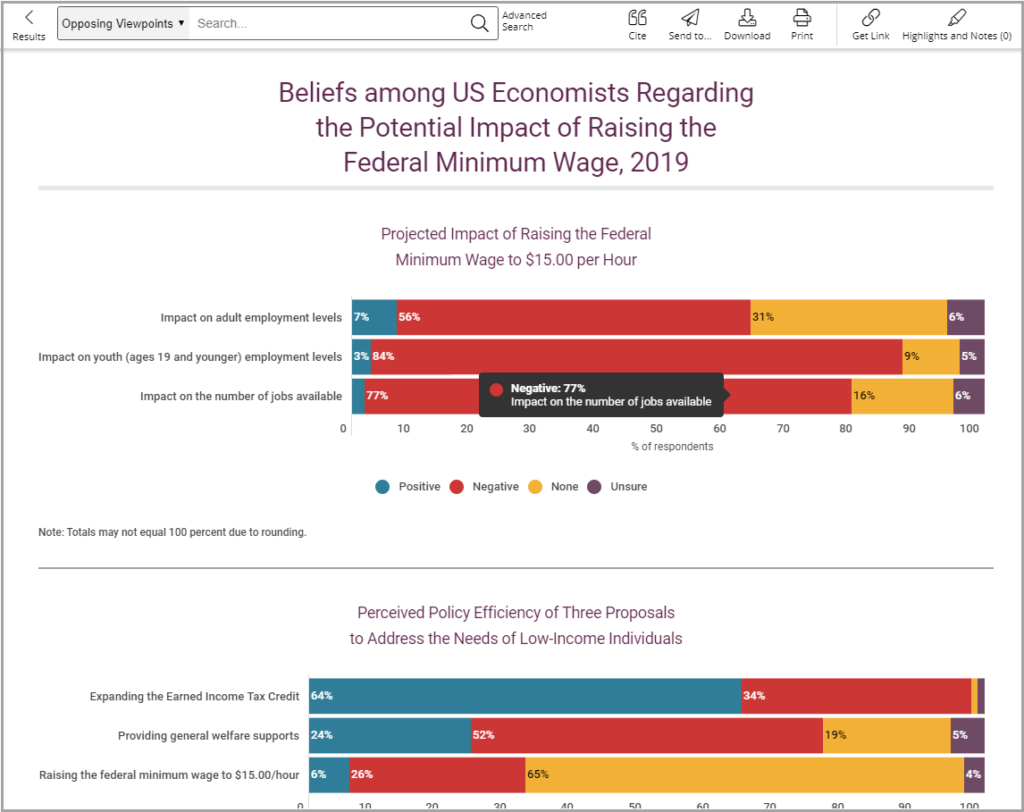
Infographics bring statistics to life, providing a clear, visual look at the data.
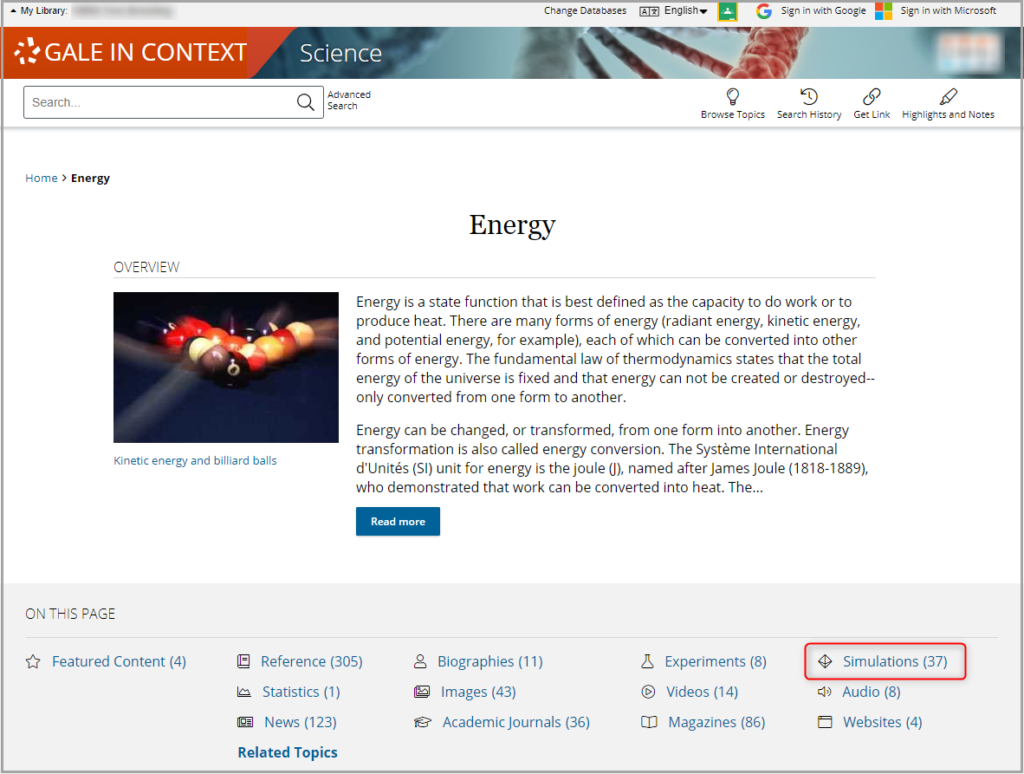
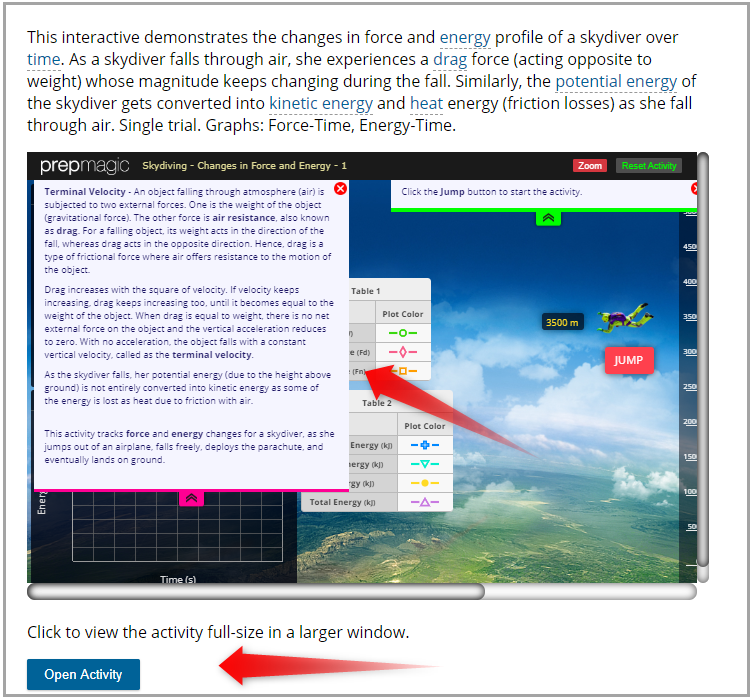
Here’s where you’ll find simulations in Gale In Context: Science on a topic portal page:
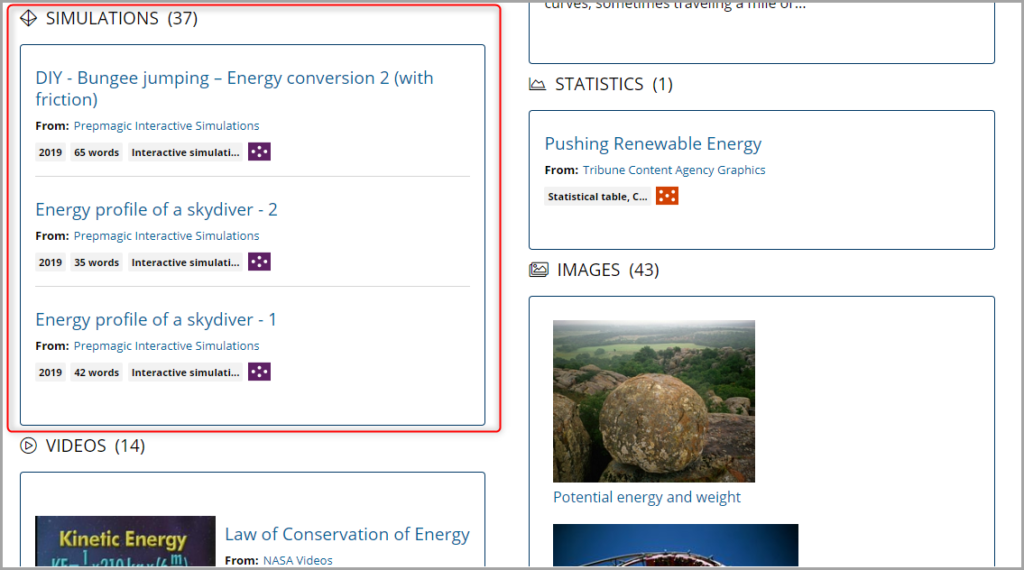
Simulated science experiments engage students, allowing them to run a simulation, change the variables, and run it again to compare results.
Both are easy to find in Advanced Search to limit results to just these types of content.
Should you have any questions or concerns, please contact your customer success manager.
Not a subscriber to Gale In Context databases? Contact your rep to learn more.
Air Jordan 1
