
| By Charlie Close, Gale Data Scientist |
Gale products are built around search. Almost all sessions start with a search, whether to begin research for a paper, study a topic for a class, or just to read something interesting. To take good care of our users, we must make sure our search functionality is working well for them.
One way we make sure search stays healthy is to define search metrics and track them across all the searches that come into Gale products.
Before I talk about the metrics, let me define a few helpful terms:
Search: when a user enters a search in a search box, or clicks a link that generates a search, for example by clicking a portal link in an In Context product.
The user is expressing an interest in the searched content, and the product gives an answer in the form of a search result or a portal page.
Retrieved Search: a search where the user opens or downloads at least one article from the search results.
For example, suppose the user searches for “dog” in Academic OneFile and the product returns a list of search results. If the user opens (i.e., retrieves) one or more articles, that search is said to be retrieved. If the user moves on to another search without opening any articles, or leaves the session completely, the search is said to be unretrieved. Every search is either retrieved or unretrieved.
Zero Search: a search that has no search results.
For example, if the user searches for “asdfasdfasdfasdf” (and some users do search for that), and if the product brings back no results, this is called a zero search. Note: a zero search can never be a retrieved search because there are no search results to open.
Session: a user session. From the time the user opens the product home page, through any searches and retrievals, to when the user leaves the product, this is one user session.
Retrieved Session: a user session where the user retrieves at least one document. A session could include no searches, one search, or many searches, and no retrievals, one retrieval, or many retrievals. Note that if a user retrieves any search during the session, then the session is also a retrieved session. A session with no retrievals is said to be unretrieved. Every sessions is either retrieved or unretrieved.
With these, we can define search quality metrics. We want the metrics to tell us whether users are finding content that’s valuable to them.
We are making a couple of assumptions about how to tell if the users like the search results they’re getting.
First, we assume that if users are retrieving searches then the search results are good, and if they aren’t retrieving searches then the search results are not as good. (Of course, it’s not as simple as that, but we think it’s a good starting place.)
Second, we assume that a zero search is always bad. No one wants to enter a search and get back nothing. (A few users search for “asdfasdfasdfasdf” and other strange things, but not many.)
With these definitions, we can define three metrics that help us keep track of search quality.
Search Retrieval Rate: the percentage of all searches that are retrieved. For example, if there are 100 searches and 36 lead to a retrieval, we say the search retrieval rate is 36%.
Zero Search Rate: the percentage of all searches that are zero searches. For example, if there are 100 searches and 8 have no results, we say the zero search rate is 8%.
Session Retrieval Rate: the percentage of all sessions that are retrieved. For example, if there are 100 sessions and 78 had at least one retrieval, we say the session retrieval rate is 78%.
We track these metrics in each product over time. We want to keep the search retrieval rate and session retrieval rate high and the zero search rate low. If any of the metrics starts going in the wrong direction, it makes us suspect that users are having a problem that we should check into.
Below are the metrics for Gale’s most popular product for K12 students, Opposing Viewpoints In Context. I’ve left out the specific values and dates, but I think you’ll get the idea.
Notice that the metrics are steady across time. In case you’re wondering, the slight drops correspond with the summer break. There are fewer users in the summer, and they might be more willing to perform unusual searches. (Summer – yeah!)
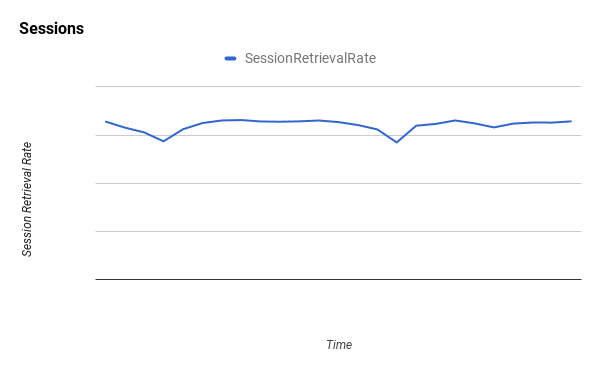
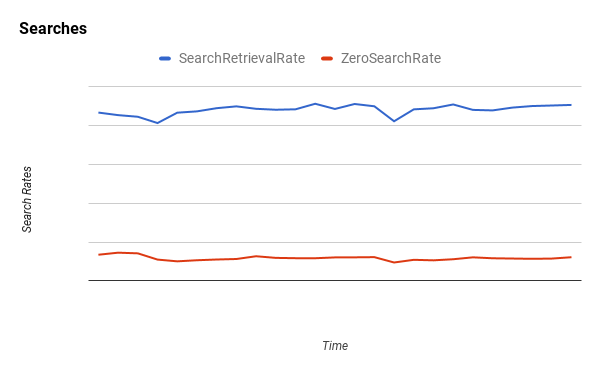
The charts above show a situation where the metrics are consistently good. In a later post I’ll look at a case where the metrics trended in the wrong direction and showed us a problem that needed to be corrected.
Stay tuned more Tech Tuesday blogs on the third Tuesday of every month!

About the Author
Charlie Close is a data scientist at Gale and former analyst on Gale’s search engine team. His research includes study of user behavior to improve Gale products.