
A sudden clap of thunder, rain hammering the windows, a gust of wind that makes the whole building creak. This kind of spectacle, equal parts thrilling and unsettling, captures students’ attention instantly. Teachers can leverage that fascination as an opening to explain what’s happening and why, using age-appropriate content that celebrates curiosity without increasing concern.
With Gale In Context: Elementary, your class can explore weather topic pages that cover natural phenomena like hurricanes, droughts, floods, and more. Each page offers articles, photographs, videos, and audio clips designed for K-5 learners, while built-in tools like adjustable reading levels, text-to-speech, and translation ensure the material can support everyone in the class, from emerging to confident readers.
To help educators bring these topics into the classroom with scientifically sound, ready-to-use resources, we step into the eye of the storm to examine the science.
Hurricanes
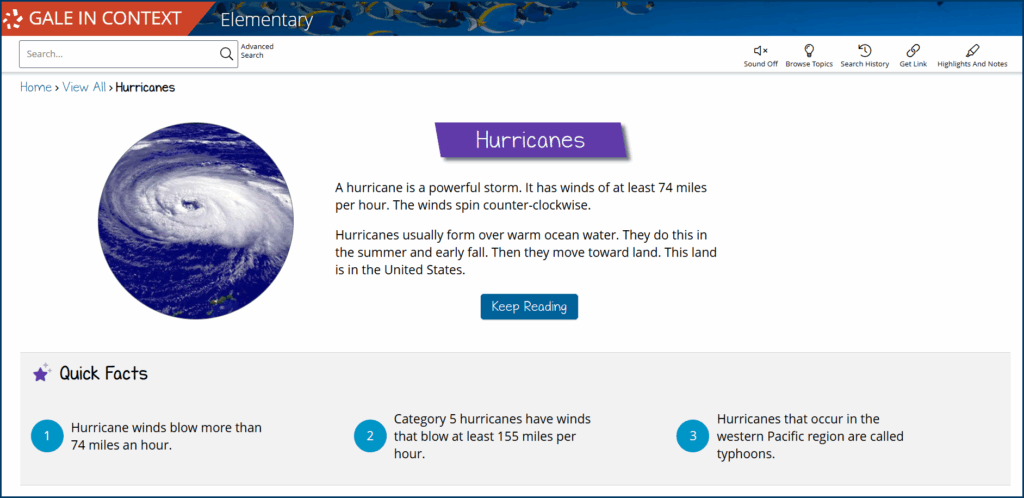
It’s late summer. Thunderstorms erupt off the coast of Africa, spilling into the Atlantic. If conditions hold, those scattered storms may travel westward, gathering strength and merging into something far more powerful: a hurricane.
Not all hurricanes begin in this part of the world, but every hurricane depends on the same ingredient—warm ocean water. When the ocean’s surface is about 80°F or warmer, it transfers heat and moisture to the air above.
That warm, moist air rises because it’s less dense than cooler air, leaving a low-pressure area at the surface. More air moves in to take its place, also warming and rising, and the cycle repeats. Because of Earth’s spin, the storm may begin to rotate, eventually organizing into a hurricane.
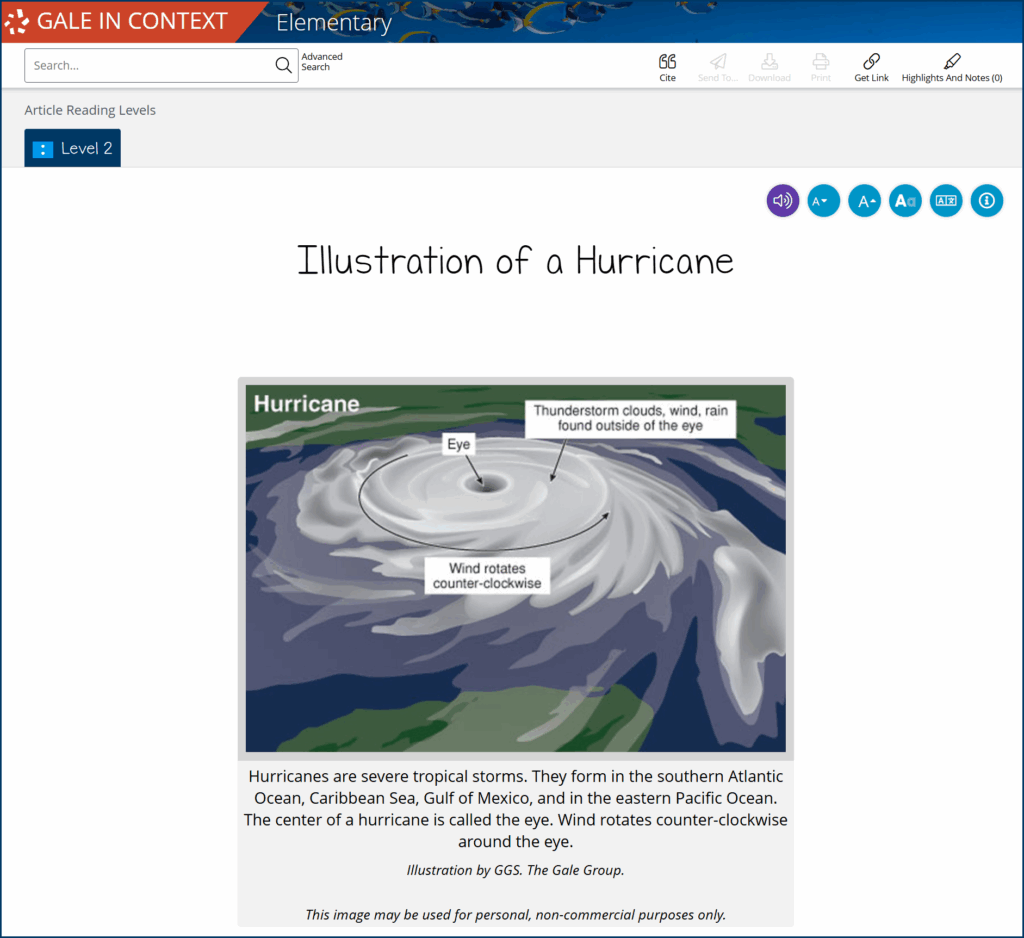

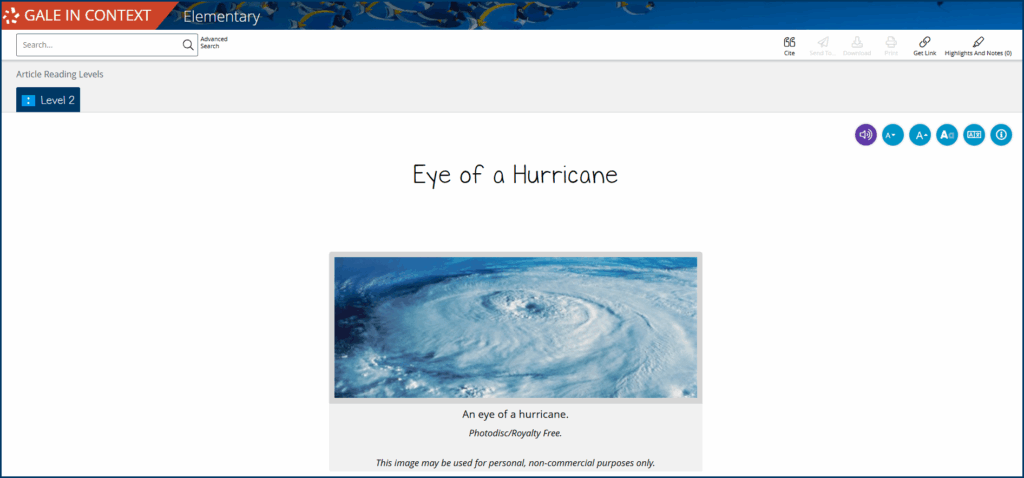
At the center sits the eye, a calm, often cloudless space surrounded by the eye wall, where winds and rain are most intense.
How Do Scientists Measure Hurricanes?
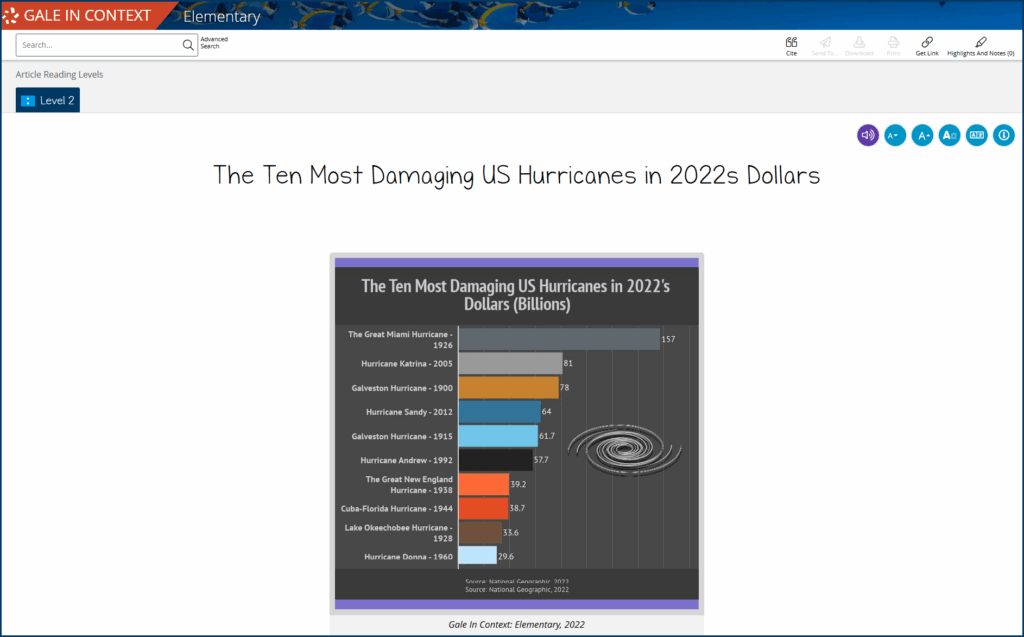
Scientists sort hurricanes into five categories on the Saffir–Simpson Hurricane Wind Scale, which measures sustained wind speed. Category 1 storms are the weakest, and Category 5 storms are the strongest. While wind speed determines the rating, storm surges—seawater driven inland by high winds—often cause the most damage.
Gale In Context: Elementary has a short quiz on reading a hurricane table, which students can use to learn about the cost of post-hurricane recovery, with examples including:
- Category 1 (74–95 mph): Hurricane Agnes (1972)
- Category 2 (96–110 mph): Hurricane Floyd (1999)
- Category 3 (111–129 mph): Hurricane Frederic (1979)
- Category 4 (130–156 mph): Hurricane Hugo (1989)
- Category 5 (157+ mph): Hurricane Andrew (1992)
How Do Scientists Predict Hurricanes?
Tracking a hurricane starts when it’s still a group of thunderstorms. Meteorologists watch satellite images for clusters of storms over warm water, check readings from buoys for ocean surface temperatures and wave height, and use radar to follow wind patterns. Specially equipped aircraft can even fly into the storms, collecting readings on wind speed and air pressure.
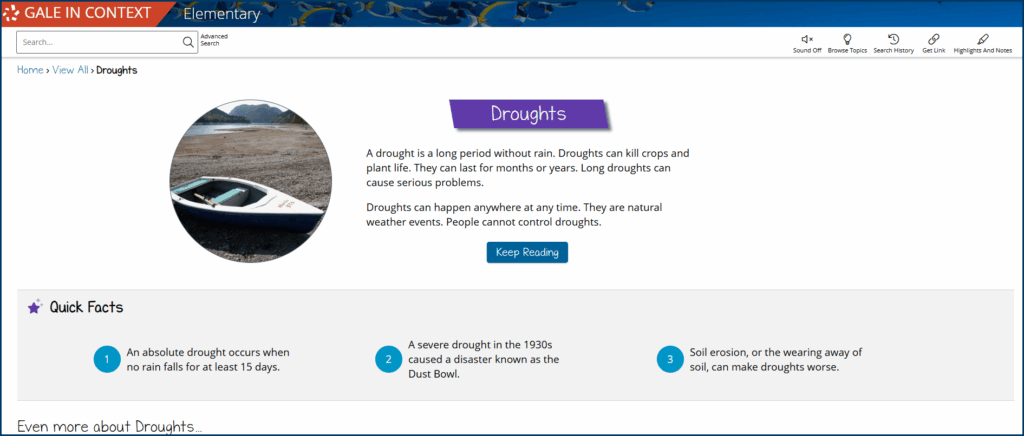
Droughts
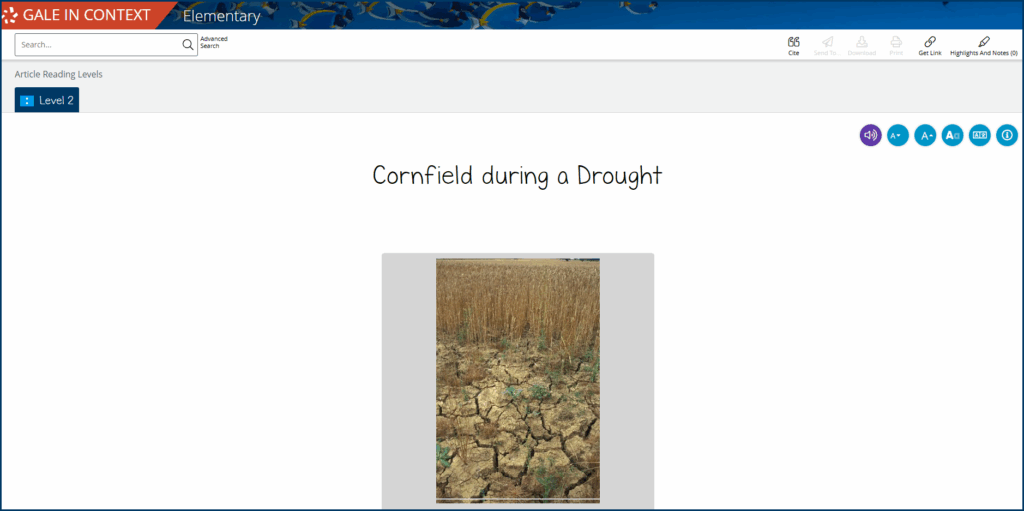
When an area goes without its usual rain or snow for an extended time—sometimes months, or even years—this can result in a drought. Without enough precipitation to refill rivers, lakes, and underground aquifers, water supplies begin to shrink.
One of the most devastating droughts in US history resulted in the Dust Bowl of the 1930s and contributed to the Great Depression. Years of below-average rainfall, combined with farming practices that left soil exposed, turned much of the Great Plains into dust. Strong winds carried away the topsoil needed for farming, crops failed, and thousands of families abandoned their land in search of work and better living conditions.
How Do Scientists Measure Droughts?
Meteorologists track droughts by looking at how current rainfall compares to what’s normal for a location. Tools like the Palmer Drought Severity Index and the Standardized Precipitation Index help them spot when an area is falling far behind its usual totals. That information complements satellite images that show the health of vegetation and reports from people on the ground.
Together, these details feed into the US Drought Monitor, which publishes weekly maps showing where droughts are happening and how severe they are.
How Do Scientists Predict Droughts?
Predicting a drought starts with watching long-term weather patterns. Meteorologists study seasonal forecasts, rainfall records, soil moisture levels, and temperature trends to spot early signs that an area might be drying out. Unlike hurricanes, which can be tracked over days or weeks, droughts often develop over months or even years.
Meteorologists also use climate models—computer programs that combine this data to project what the coming months could look like. If the models show continued heat and little chance of rain, they can issue early warnings so farmers, water managers, and communities have time to prepare.
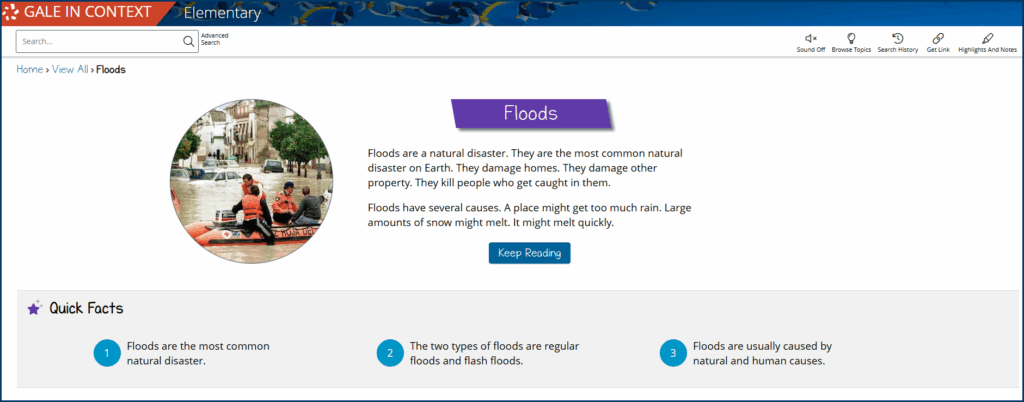
Floods
Flooding happens when water moves into places that are usually dry—streets, fields, neighborhoods. Sometimes the water rises slowly, inch by inch. Other times, it surges in so quickly that people have only minutes to react, which is called flash flooding.
Scientists often group floods by where they occur, and what causes them:
- River floods occur when rain or snowmelt raises a river’s water level beyond its capacity.
- Coastal floods are driven by high tides, storm surges, or tropical cyclones.
- Urban floods happen in cities where paved suraces prevent water from soaking into the ground.
- Flash floods develop quickly after intense rainfall or sudden dam or levee failure, with water powerful enough to sweep away cars, buildings, and soil.
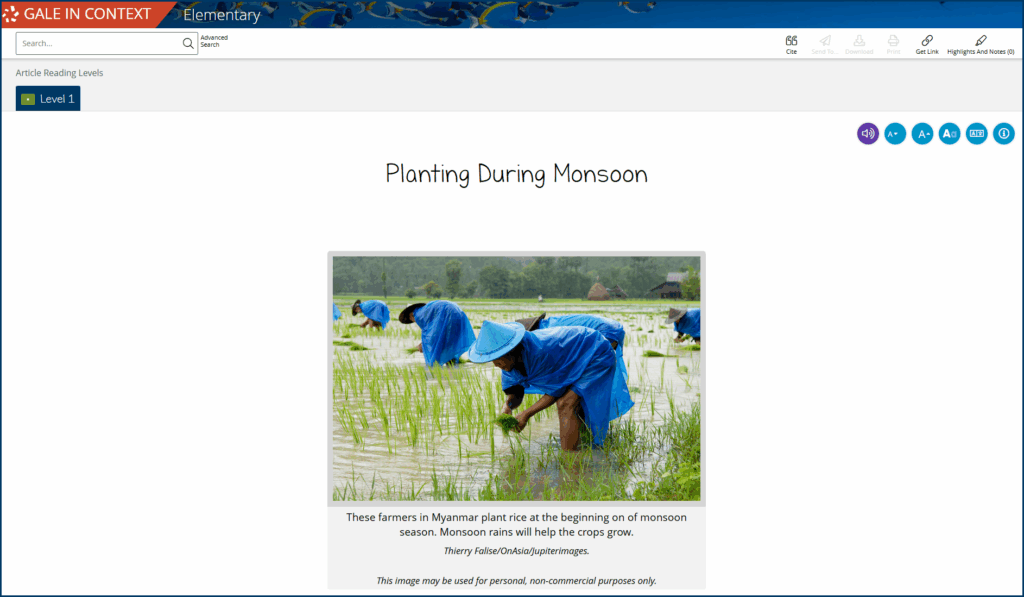
In August 2022, during one of Pakistan’s heaviest monsoon seasons on record, a particularly devastating river flood took place. Weeks of rain pushed rivers past their banks, carrying away roads, bridges, and whole villages. At the height of the flooding, more than a third of the country was underwater, forcing millions from their homes and leaving large stretches of farmland unusable. Officials had issued warnings, but the sheer amount of rain and runoff was more than existing flood defenses could handle.
How Do Scientists Measure Floods?
Scientists track floods by measuring how much water flows through rivers, lakes, and reservoirs and how quickly those levels change. They install stream gauges along waterways to record water height and speed, use rain gauges to measure precipitation, and check snowpack levels to estimate future meltwater.
They pair these ground readings with satellite and aerial images that reveal how far the water has spread and how it shifts over time. In high-risk areas, sensors trigger real-time alerts when water reaches certain depths.
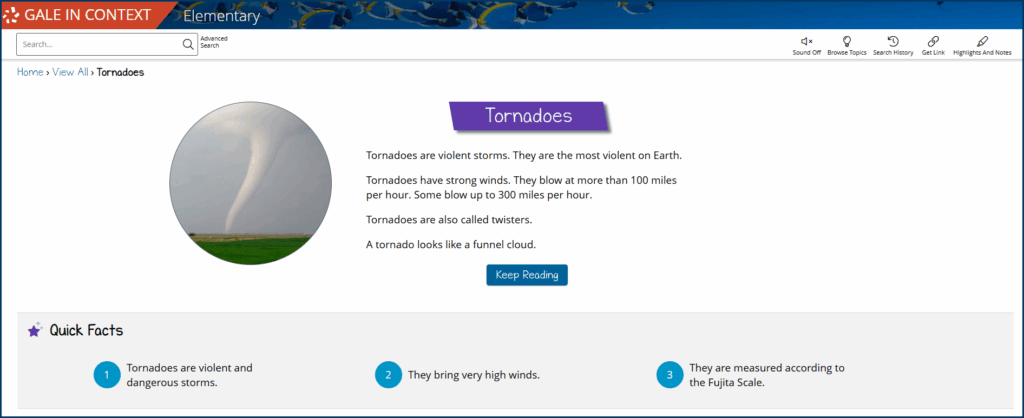
Tornadoes
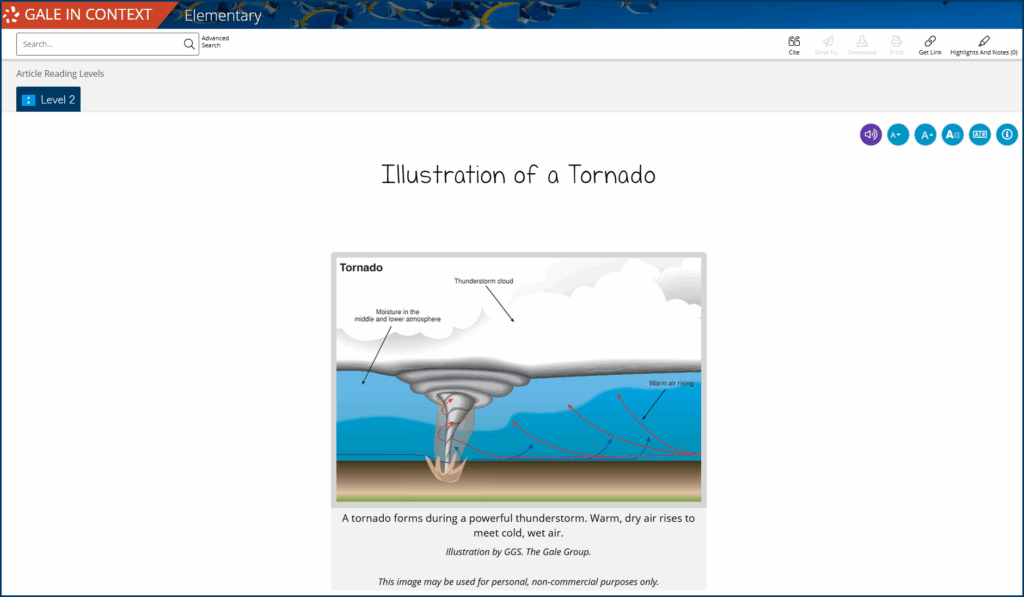
Tornadoes begin inside powerful thunderstorms. When a storm draws in two very different kinds of air—one warm and moist, the other cool and dry—the clash can make the atmosphere unstable. If winds higher in the sky blow at a different speed or direction than winds near the surface, pockets of air may begin to spin horizontally. Powerful updrafts in the storm can tip this rotation upright, pulling it tighter until a funnel cloud forms. Once that funnel touches the ground, it becomes a tornado.
In the United States, tornadoes appear most often in a swath of the central Plains known as Tornado Alley. This stretch runs from northern Texas through Oklahoma and Kansas, into Nebraska, and as far north as South Dakota. Here, warm, humid air from the Gulf of Mexico collides with cooler, drier air from the Rocky Mountains and Canada.
Peak season depends on the region. In the southern Plains, the highest activity is usually in May and early June. Further north, across the northern Plains and upper Midwest, tornado season arrives later, peaking in June and July as warm, moist air pushes northward. In the Southeast, strong storm systems can even trigger tornadoes in winter.
How Do Scientists Measure Tornadoes?
Meteorologists rate tornado strength using the Enhanced Fujita (EF) Scale, which estimates wind speed by examining the type and severity of damage left behind.
- EF0 (Gale): 65–85 mph winds
- EF1 (Moderate): 86–110 mph winds
- EF2 (Significant): 111–135 mph winds
- EF3 (Severe): 136–165 mph winds
- EF4 (Devastating): 166–200 mph winds
- EF5 (Incredible): 200+ mph winds
Did you know? The 1999 tornado in Bridge Creek, OK, topped out at more than 300 mph—the strongest tornado ever recorded.
How Do Scientists Predict Tornadoes?
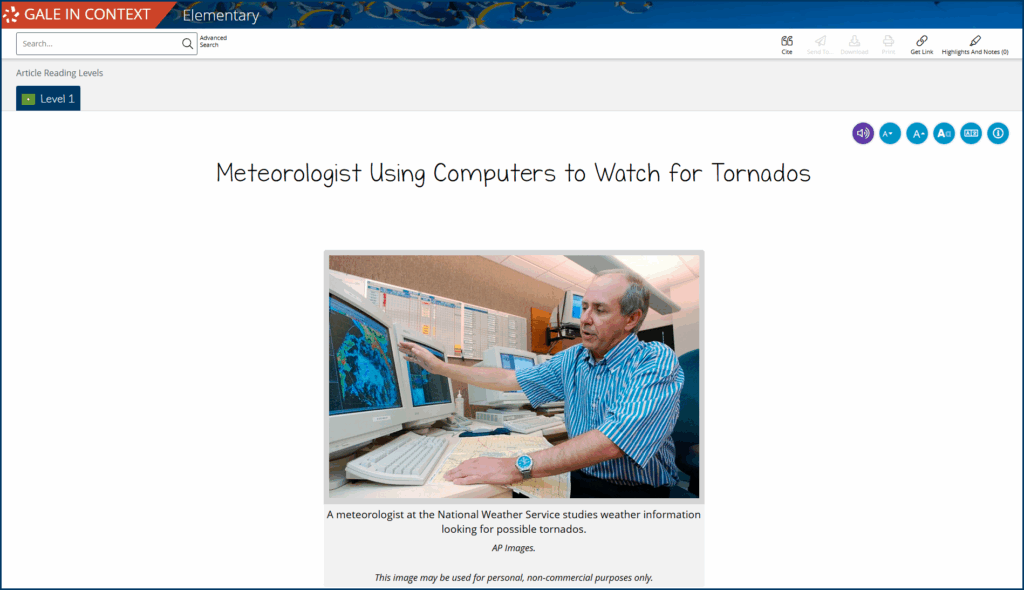
Tornado detection starts with Doppler radar, which can identify rotation inside a thunderstorm before a funnel cloud forms. Forecasters compare this with satellite images, readings from weather balloons, and reports from trained storm spotters or chasers on the ground.
When conditions are right for tornadoes to develop, meteorologists issue a tornado watch to alert people. If radar or eyewitness reports confirm that a tornado is forming or has touched down, they upgrade the watch to a tornado warning.
Because tornadoes can develop and move quickly, warnings often only give a 10–15 minute head start. Still, even that short window can mean the difference between reaching shelter and being caught outside.
Other Types of Natural Disasters
The extreme weather we’ve focused on—hurricanes, droughts, floods, and tornadoes—is shaped by conditions in Earth’s atmosphere, but not every natural disaster begins with the weather. Some are caused by shifts in the Earth’s tectonic plates.
Students interested in how Earth’s inner forces reshape the planet can keep exploring with Gale In Context: Elementary topic pages on earthquakes, volcanic eruptions, and tsunamis.
Classroom Activity: Designing Community Preparedness Plans
Begin with a short discussion on the difference between preparedness (actions taken before an event) and response (actions taken during or after). Then, divide students into small “planning committees.” Give each group a town profile and an extreme weather scenario card.
- Town Profile: Location, population, major industries, key landmarks, environmental features—rivers, coastlines, farmland, mountains, etc.
- Scenario Card: Event type, timing, severity (such as a Category 3 hurricane approaching in four days or an EF4 tornado risk during storm season).
Task each group with designing a preparedness plan that addresses three key stages:
- Early Warnings: How will the community know an event is coming? How will information reach all residents, including those without internet or phones?
- Preparation Actions: What steps should be taken before the event, such as securing property, storing water, moving livestock, building infrastructure, and designating shelters. You can find an example of preparation in the article, “Florida’s Hurricane-Proof Town!”
- Recovery Steps: What should happen immediately afterward to keep people safe and help the community rebuild?
Encourage groups to back up each decision with reasoning based on the science of the event. For example, a hurricane plan might prioritize reinforcing buildings near the coast because wind speeds increase over open water, while a drought plan might focus on water rationing.
Activity discussion questions:
- What challenges might prevent a good plan from working as intended?
- In your plan, how do you make sure everyone in the community—including elderly residents, young children, and people with disabilities—can stay safe?
- How would you decide which services to restore first after the event?
- Extension Question: How might your plan change if your town’s location were different: inland vs. coastal, flat plains vs. mountainous terrain, etc.?
Even the fiercest storm becomes less overwhelming when students understand the science behind it. With age-appropriate, scientifically sound resources, they can see the patterns at work and the steps people take to stay safe, so they can trust in the plans and protections around them.
Contact your local Gale sales representative to learn more about how Gale In Context: Elementary can support your extreme weather lessons and give your students the tools to feel prepared for anything that comes their way.