
Fancy New Tool, Now What?
| By Gale Staff |
Tableau Reader is a free desktop application used to open and interact with data visualizations. Starting May 15, all users of Gale Analytics will have the ability to drill down into rich visuals, view dynamic maps, and market to specific patron segments using Tableau Reader.
Below are simple steps users can follow to leverage Gale Analytics and Tableau Reader dashboards.
Download Tableau Reader
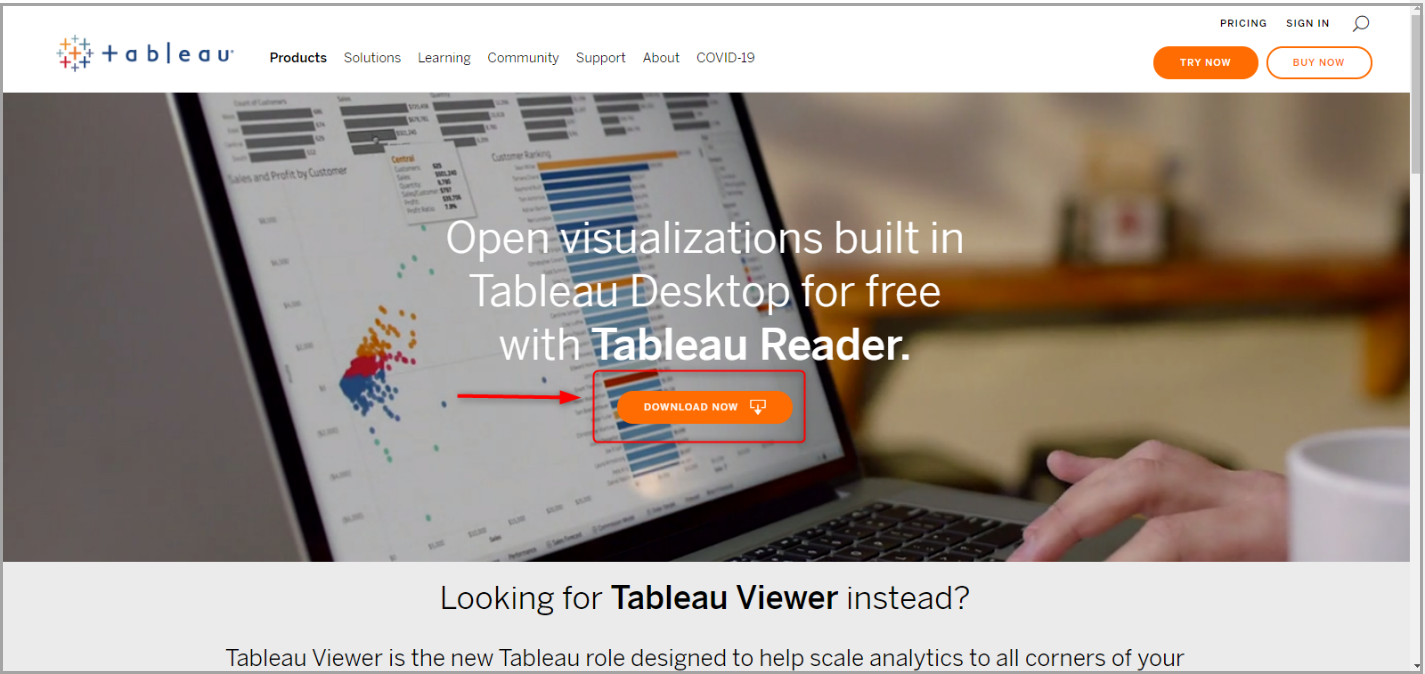
Visit the product page for Tableau Reader. Select the Download Now button on the home page banner. The file will download to your computer.
Install
Tableau Reader to Your Computer
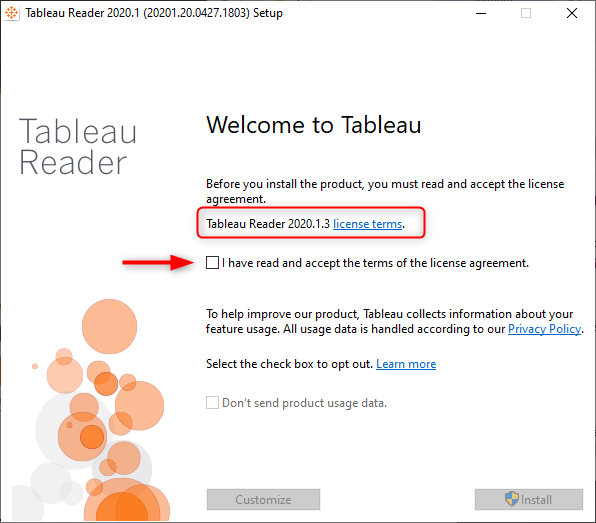
Once the download is complete, open the file to display the setup instructions. Read the terms of the license agreement, accept the terms, and select Install.
Once the installation process is complete, you’ll be dropped into a new Tableau workbook. Simply close out of this workbook and open the Tableau Packaged Workbook (.TWBX) file from Gale Analytics.
The .TWBX file is provided after a user uploads and runs their data analysis in Gale Analytics.
Open the .TWBX File from Gale Analytics
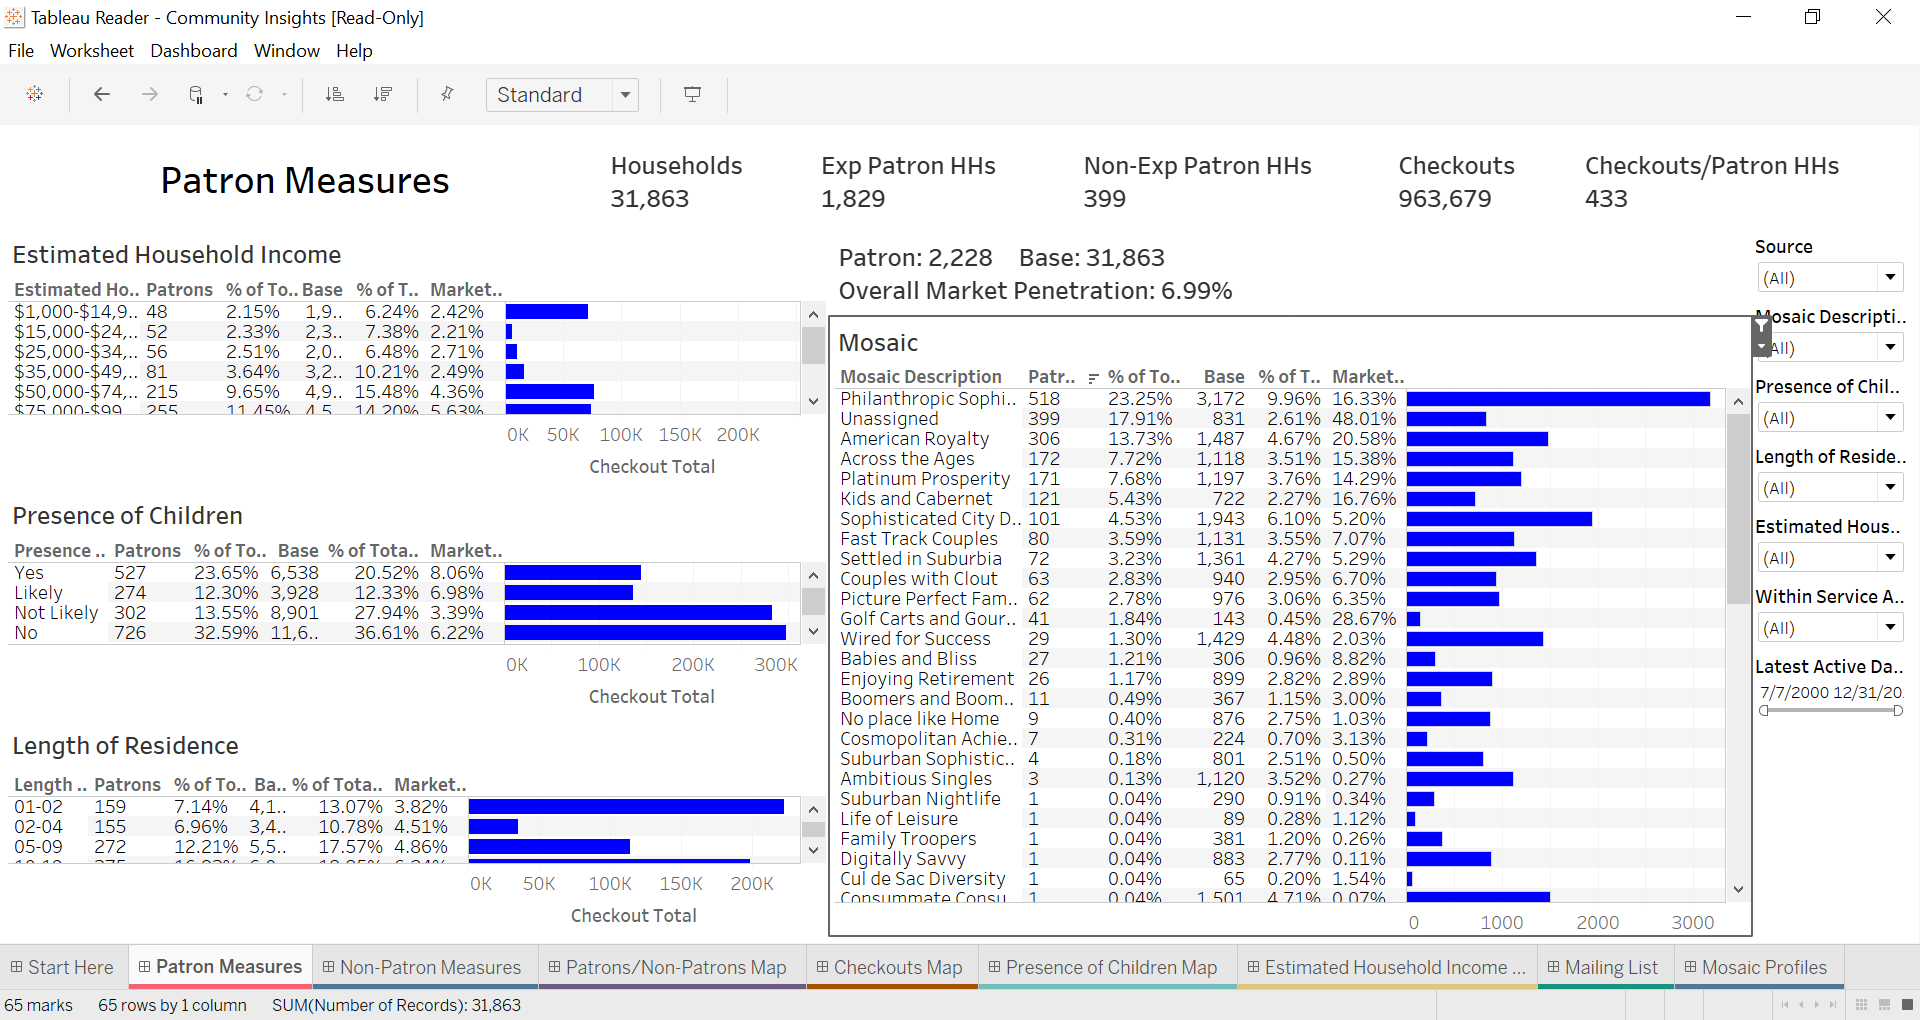
Voilà! Welcome to the Gale Analytics dashboard!
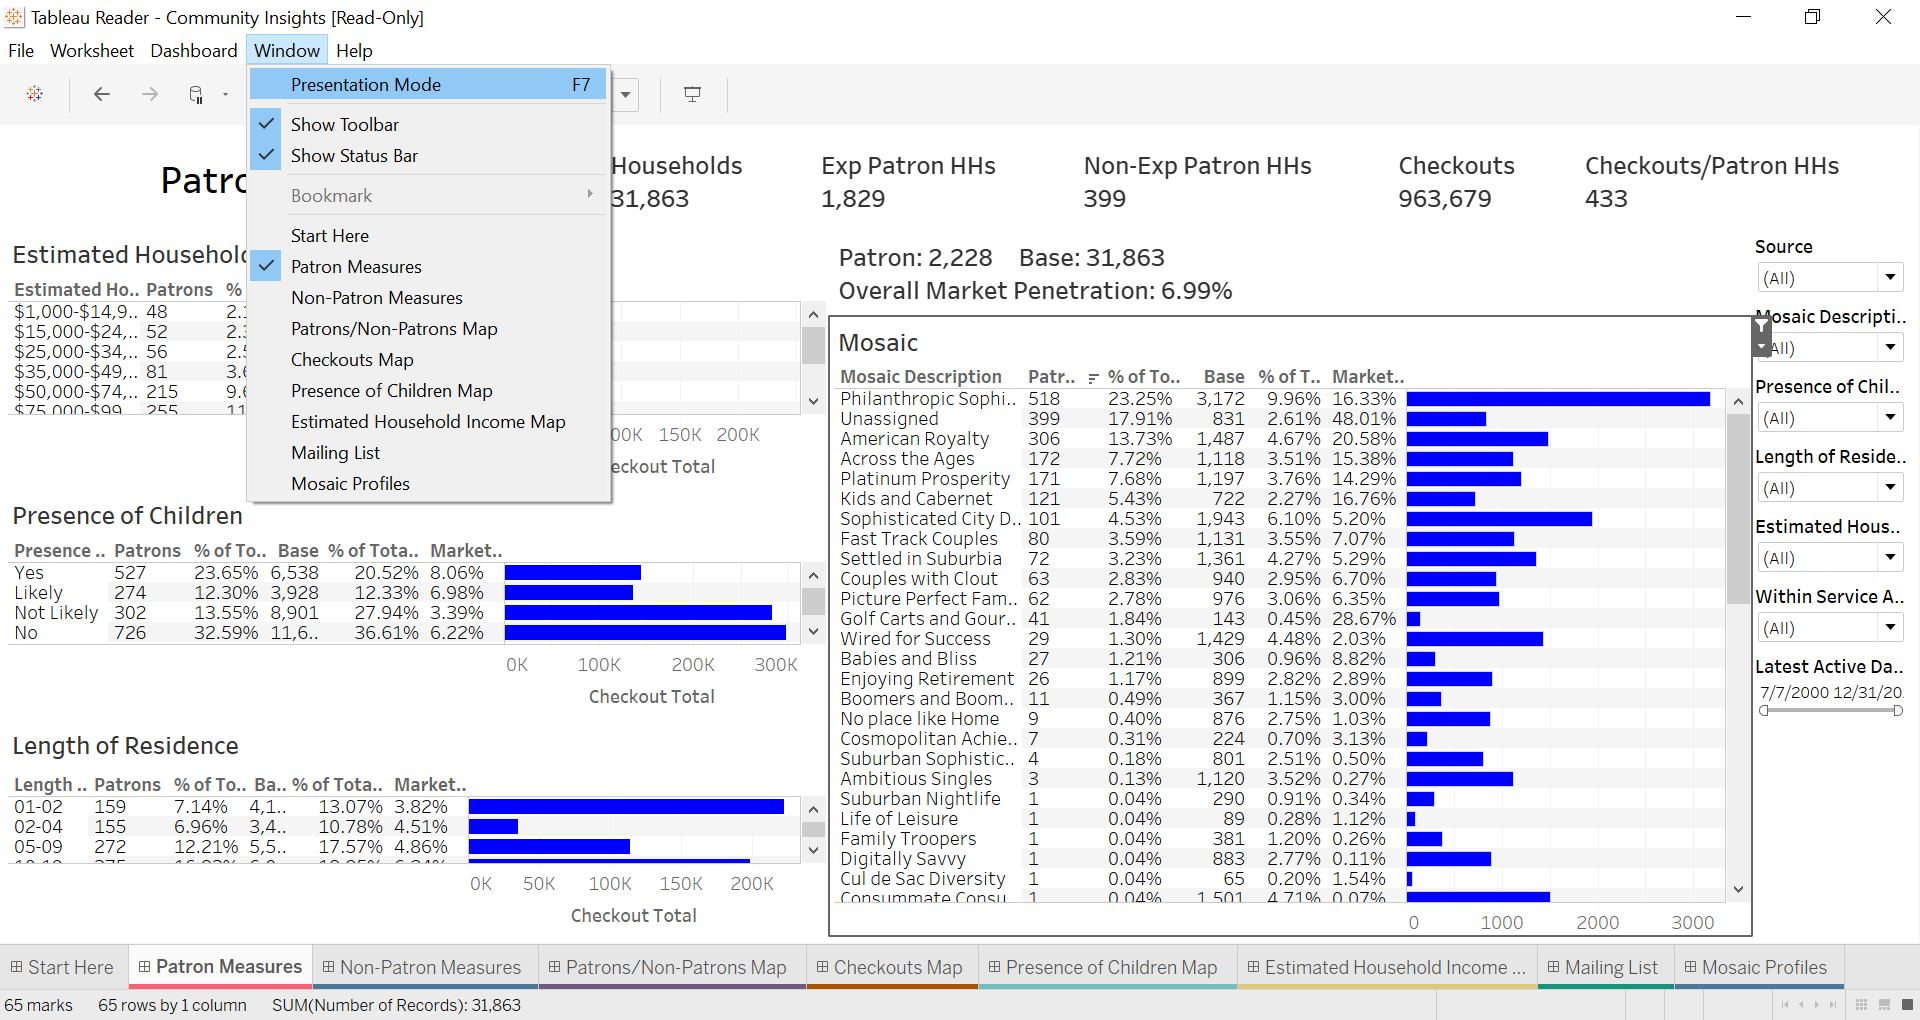
Users can view the workbook in presentation mode, which provides a clean view by removing the main navigation and toolbar. To select this view, either navigate to the Window tab in the menu bar and choose Presentation Mode or select the last icon in the toolbar that looks like a computer screen. Use the keyboard Escape (ESC) key to exit presentation mode.
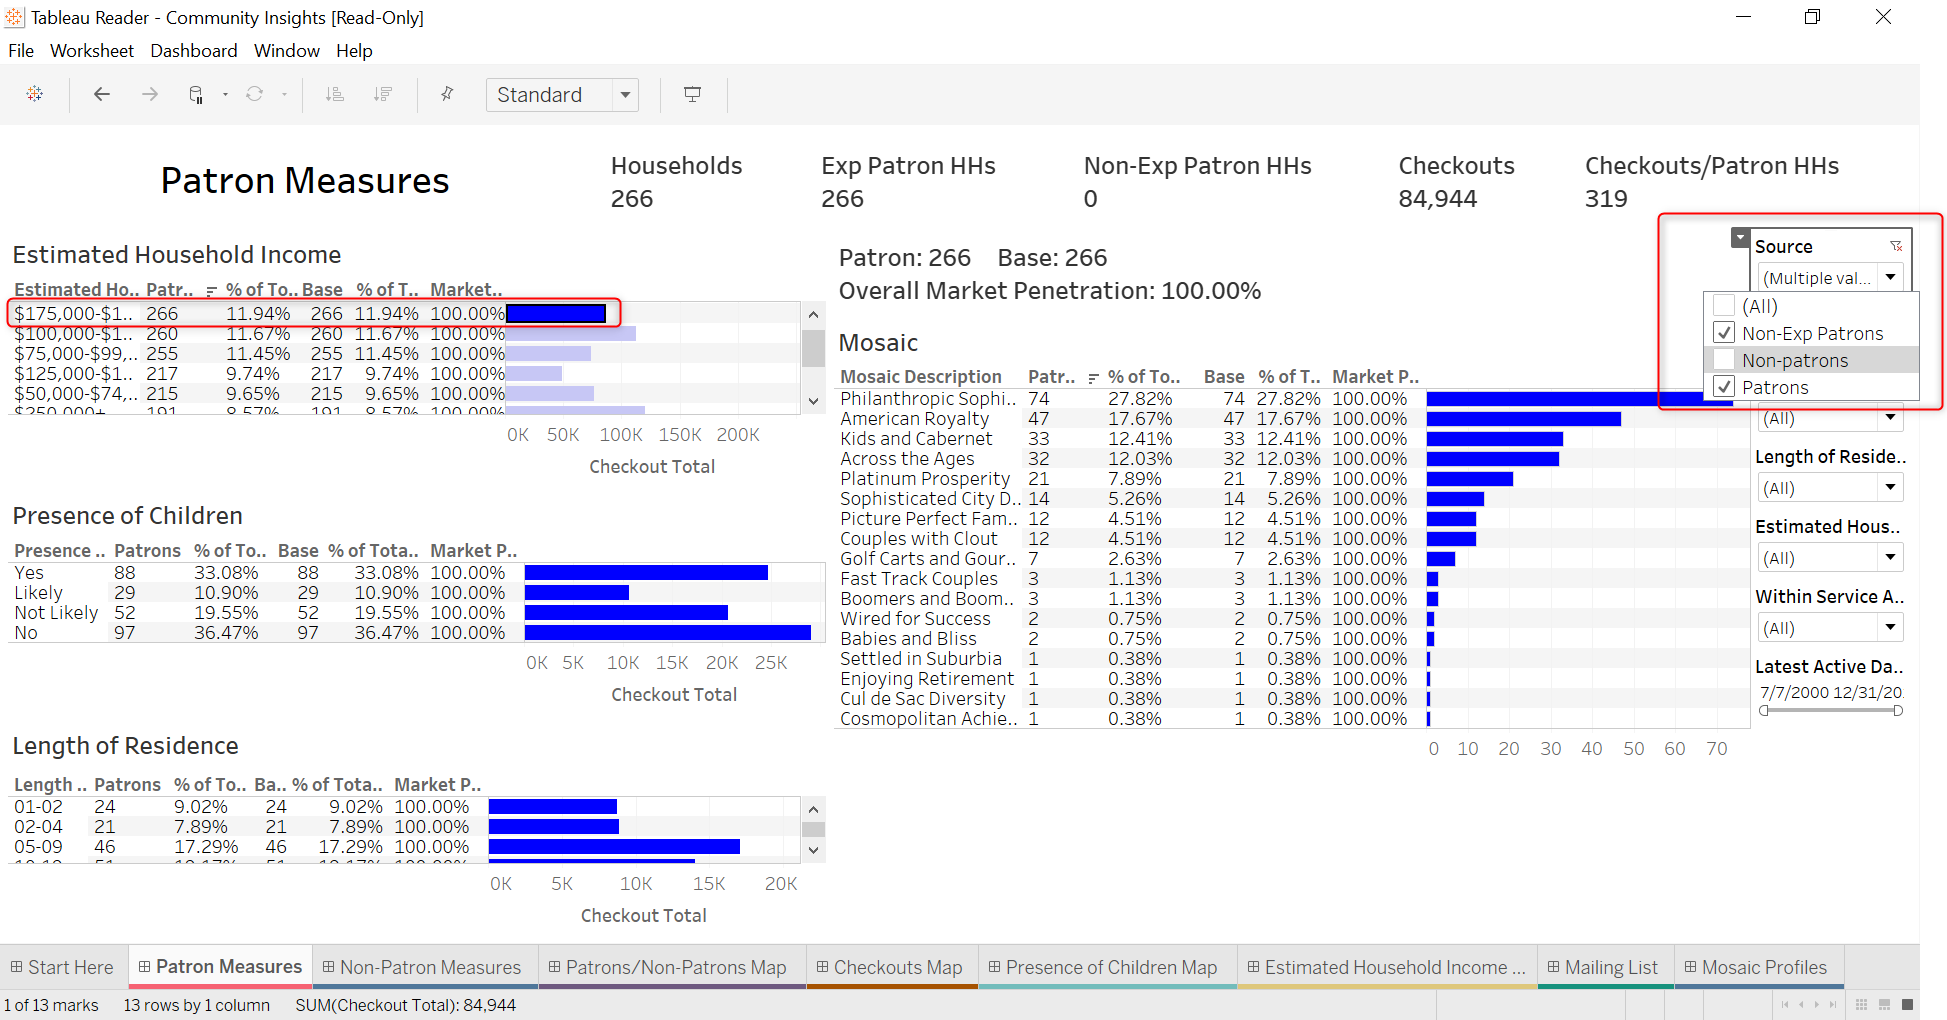
Select criteria from the dropdowns and filters on the right or choose visual components within the report (e.g., income brackets, mosaic description names, bar charts, etc.) to drill down into your data.
As an example, based on the filters applied below, we’re looking at patron households that fall within the $175K‒$200K income bracket. This income bracket holds the highest percentage of total patron households. We can now see that the top two mosaic segments based on the criteria selected are Philanthropic Sophisticates and American Royalty.
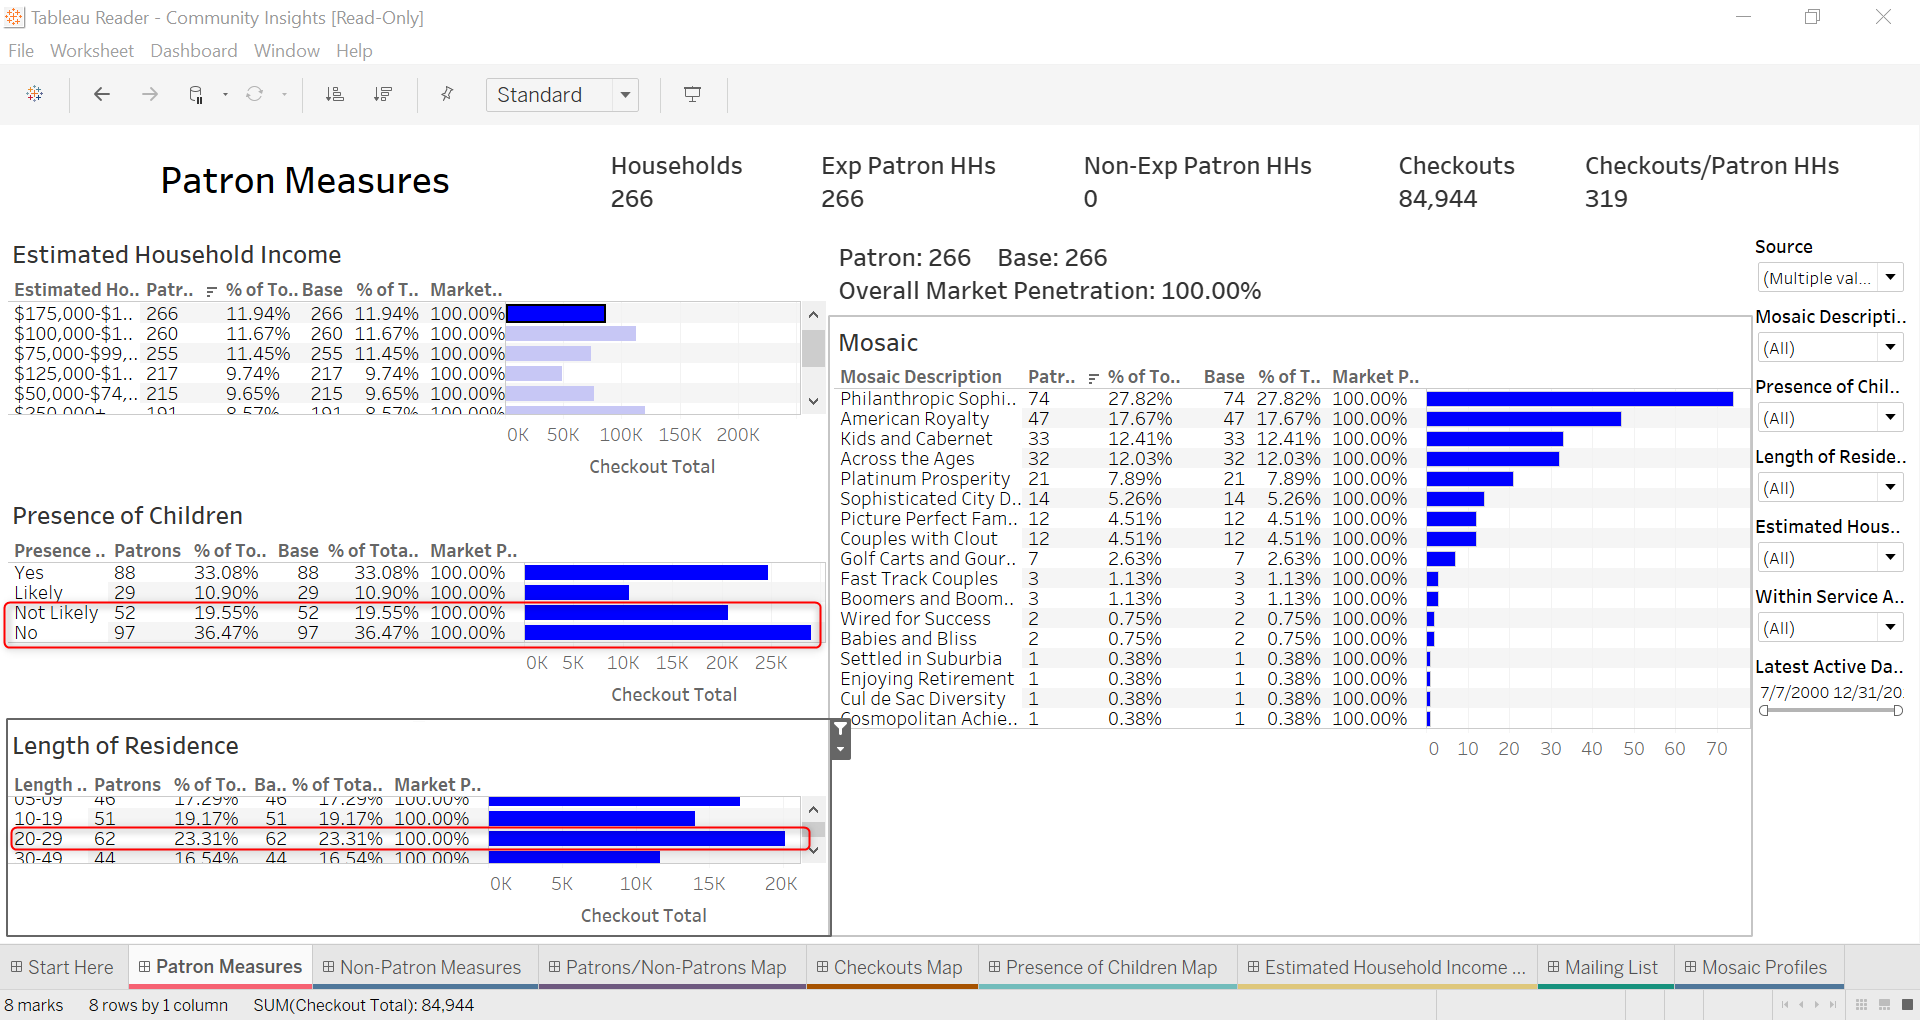
Users can drill down even further to learn that although 33 percent of households may have the presence of children, these households are more likely to not have children. These households tend to be established households in the area, with the most prominent length of residence bracket to be 20‒29 years.
To really dig into the Philanthropic Sophisticates mosaic, users can select the Mosaic Description name. A field will display a link to access the full mosaic description from Experian.
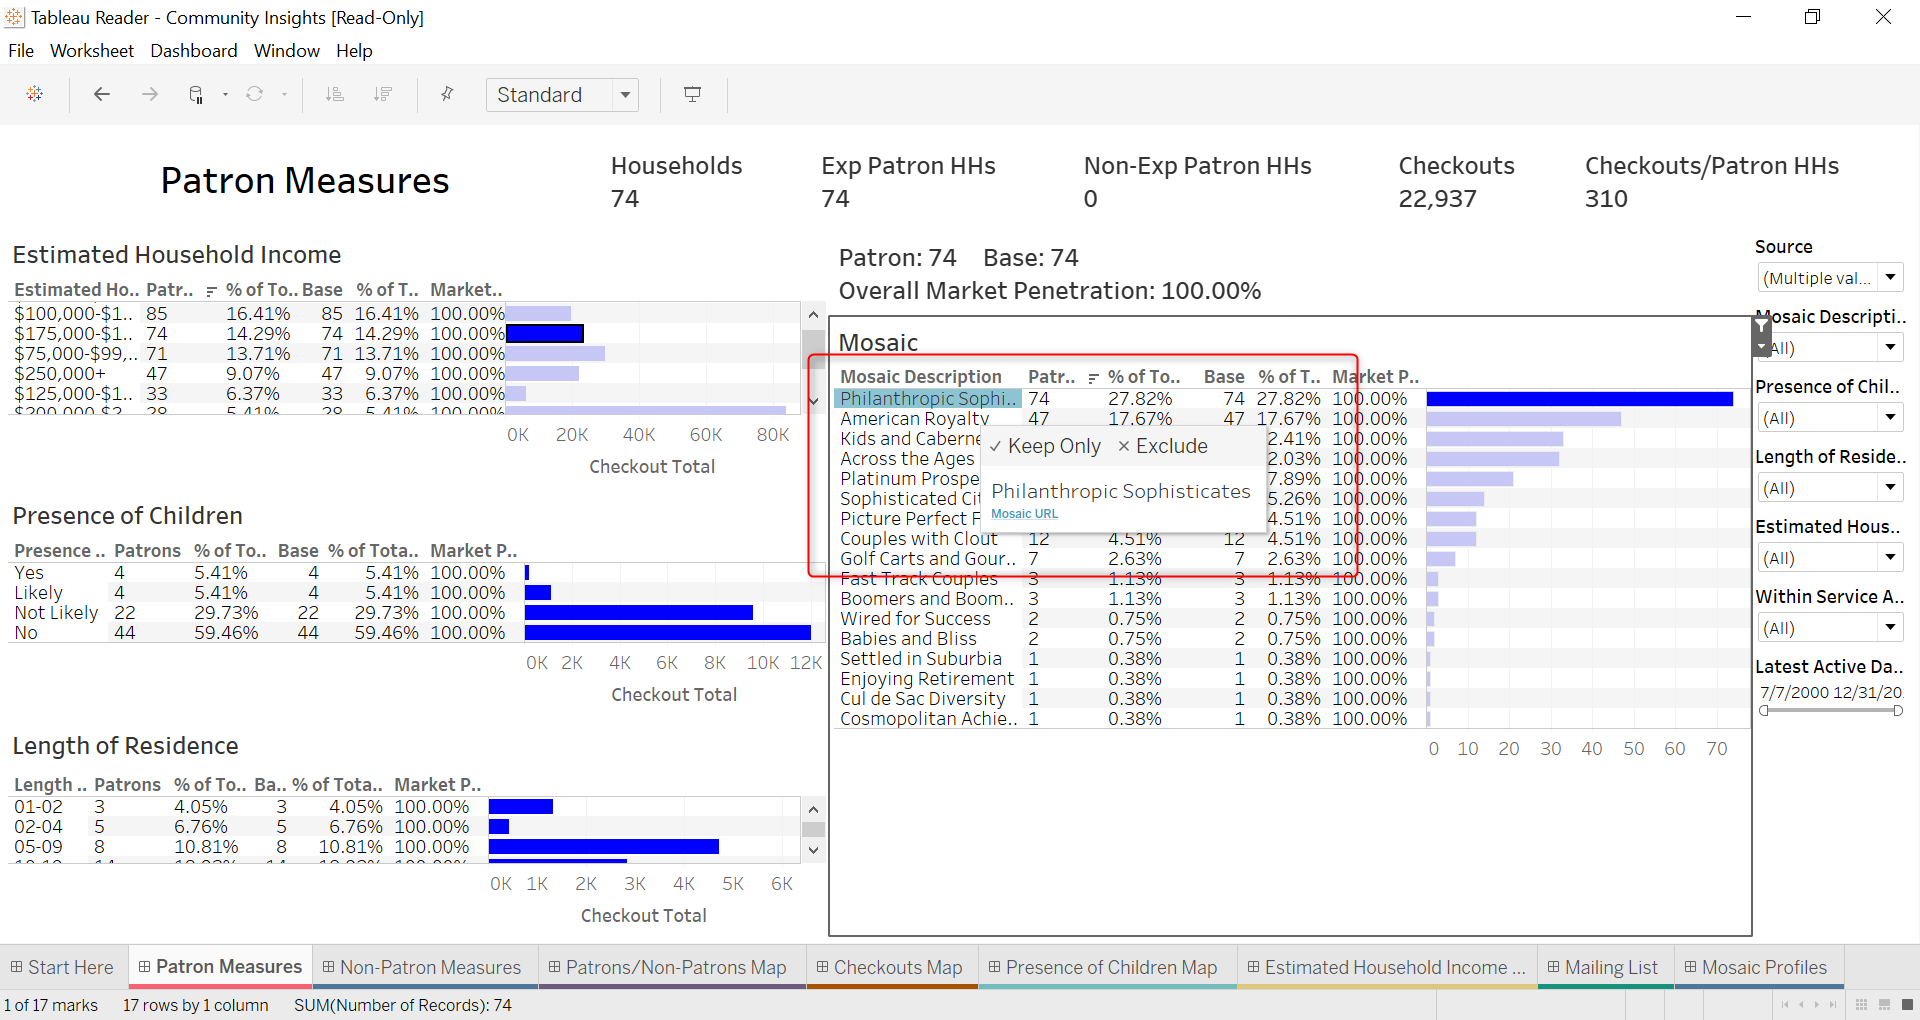
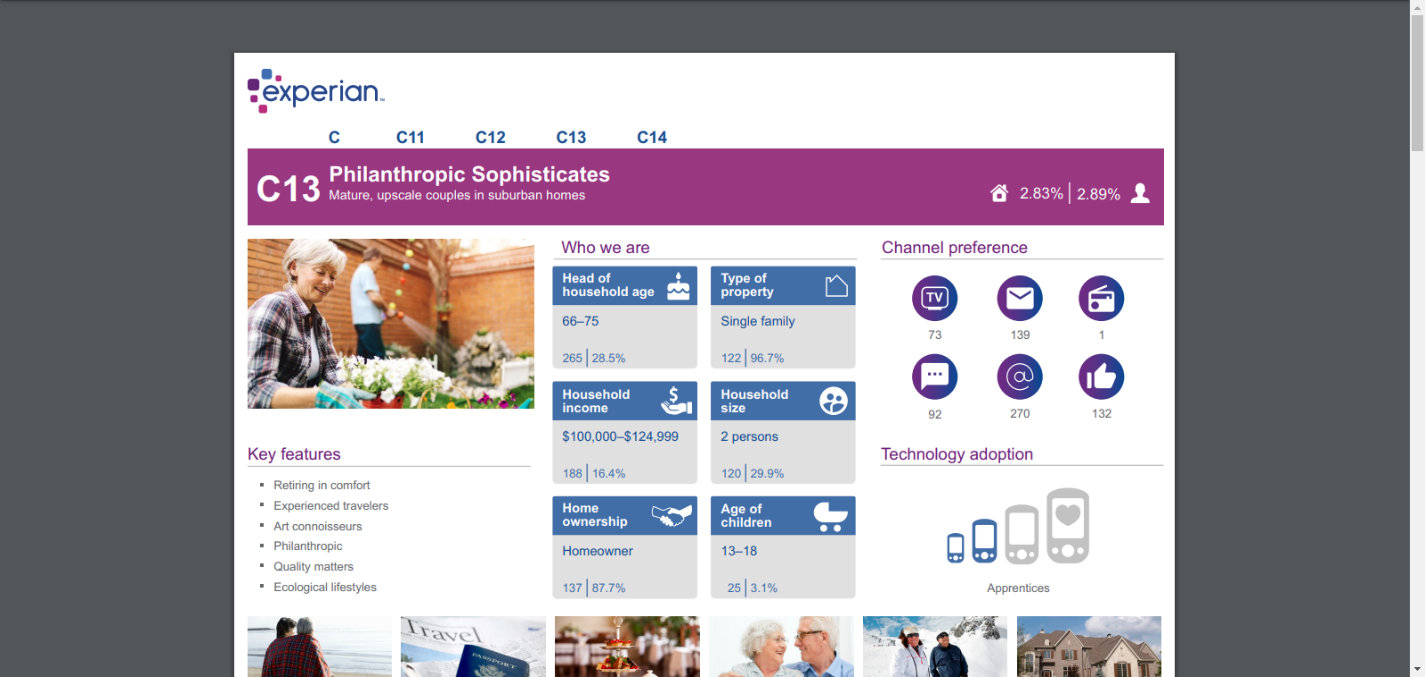
View or download the full Mosaic Description, which includes technology adoption, channel preference, household size, home ownership, and so much more!
Check out these short videos that highlight a handful of the dashboards and key visuals.
Contact your customer success manager with questions about setup. For any specific insights you’re looking to gain or decisions you need to make using Gale Analytics, please reach out to Lisa Novohatski.
Trail Running