
| By: Gale Staff |
Demographic Reach Map Available in Select Dashboards
Gale Analytics: Community Insights and Patron Insights now offer users the ability to understand their demographic reach by combining a census view of race/ethnicity by tract, with variables such as education level, household income, and race/ethnicity. Using census data provided by Experian, census tracts are color coded based on the density of the presence of a selected race/ethnicity in that area.
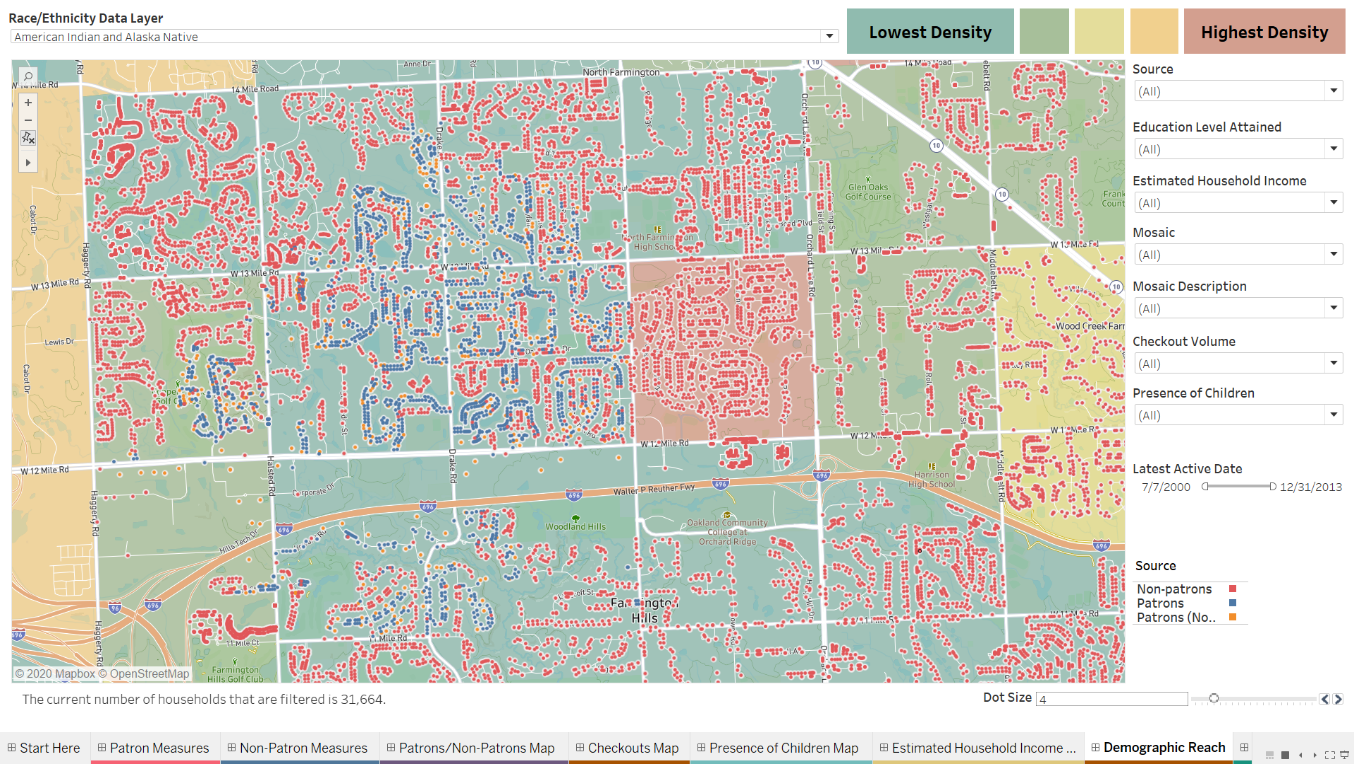
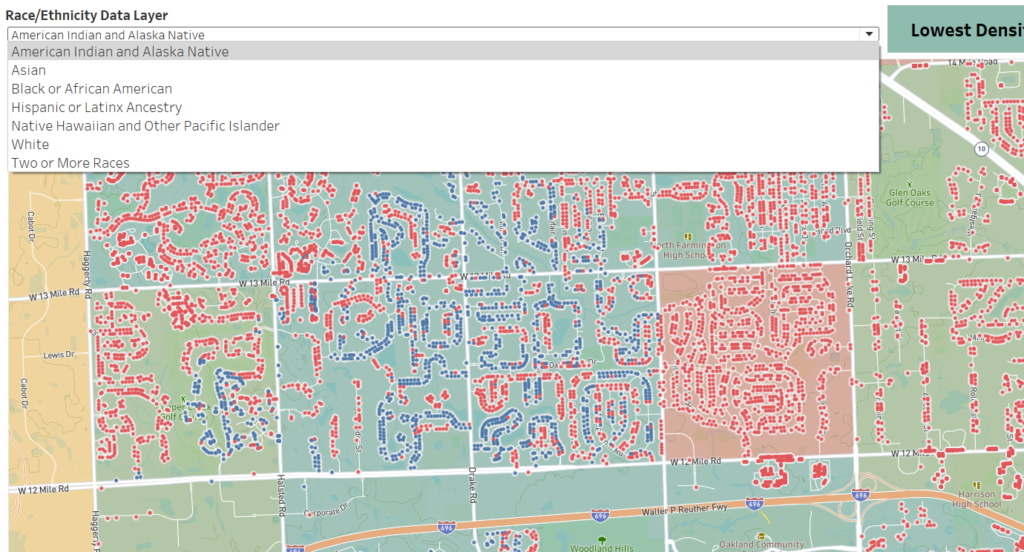
Users can simply select a race/ethnicity from the drop-down menu at the top of the dashboard to view patrons and nonpatrons present in the census tract.
Users can then filter households by education level and estimated household income (among other characteristics such as checkout volume and presence of children) to visualize where the library is having the highest impact and where it can equitably enhance its reach.
This new dynamic visual provides libraries with the much-needed data view to audit how their library meets the needs of various households in the community. To begin using this feature, simply run a new Gale Analytics dashboard report. For a more in-depth explanation of how you can use this feature
For a more in-depth explanation of how you can use this feature, read this blog.
Race/ethnicity terminology is provided by Experian, and data is refreshed quarterly. To request more information or a demo of this feature, please reach out to our data experts.
Air Jordan 1 Mid “What The Multi-Color” For Sale