
| By Charlie Close, Gale Data Scientist |
Most of Gale’s products are built around users searching Gale content. For example, a user might search World History In Context for “Bastille Day” to find articles about the French Revolution. Giving high-quality search results is a big part of taking care of our users.
In a previous post, I introduced the metrics we use to measure the quality of the search results in our products. We watch the metrics over time to make sure we are providing good search results. This post is about a case when the metrics showed us that we had a problem we needed to fix.
Here’s a typical chart of two of the metrics for Opposing Viewpoints In Context:
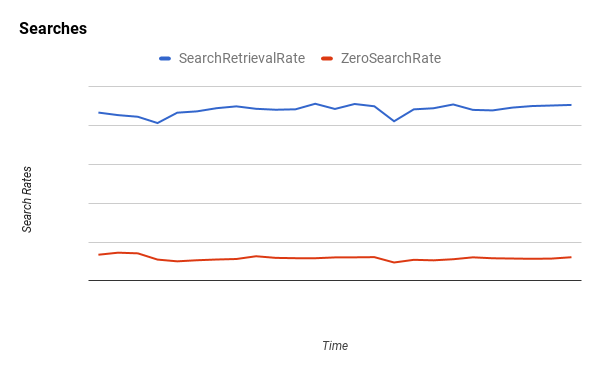
The chart shows two metrics:
Search Retrieval Rate (the blue line): the percent of searches that lead to at least one retrieval, i.e., a click on a search result. We assume that users click on results they find helpful, so we want to keep the retrieval rate high.
Zero Search Rate (the red line): the percent of searches that have no results. We assume that if a search has no results, it’s frustrating for the user, so we want to keep the zero search rate low.
The thing to notice about the above chart is that it’s pretty boring. The search retrieval level is high and the zero search rate is low, and they’re both holding steady. While the metrics can always be better, a chart like this is what we hope to see.
Now let me show you a chart from Academic OneFile from a while ago that’s a lot more interesting:
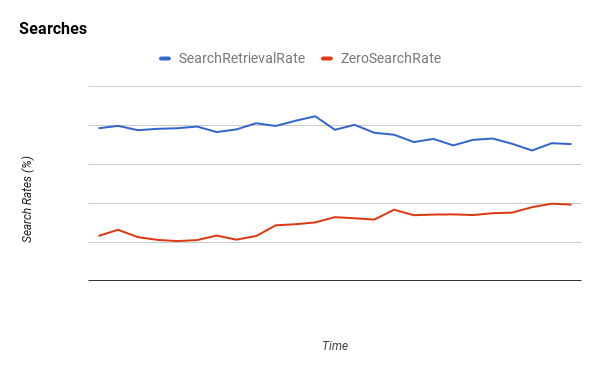
Notice how the lines are flat early on, then midway the search retrieval rate starts to fall and the zero search rate starts to rise. This is what it looks like when more and more users are struggling to find content.
As the trends continued it became increasingly clear that it wasn’t a self-correcting problem and we needed to find it and fix it.
We tried to find a pattern in the searches that explained the trends. The first question we asked was whether the metrics were going in the wrong direction for different reasons or for the same reason. A search can be unretrieved (blue line goes down) either when there are no search results, in which case it’s also a zero search (red line goes up), or when there are search results but the user doesn’t click any of them (blue line goes down but red line holds steady).
In our case, we looked at the subset of unretrieved searches that were not zero searches and found that the retrieval rate held steady. The retrieval rate fell only when we included the zero searches. Therefore the real problem was the zero searches.
So: what was causing all the zero searches? We looked at individual zero searches and saw that most of them came from our customers’ discovery systems sending requests for periodical content. Periodical searches have a consistent pattern. In most cases the search tries to find an article by its ISSN number (i.e., publication), volume number, issue number, and starting page number.
The problem with periodical searches is that discovery systems can get their metadata from various sources outside of Gale and it’s possible for there to be mismatches between their metadata and Gale’s. For example, for a given article the discovery metadata might have a starting page number and Gale might not have a starting page number. If the Gale product performed a search with all four parameters and they didn’t all match identically, the result was a zero search.
Once we could see what the problem was, it was clear how to handle the situation more gracefully. We added logic to search using all the parameters we were given, but if we couldn’t match all four, we would back down to three (publication, volume, and issue), then down to two (publication and volume), and so on. We might not be able to take the users to the exact article, but we could get close enough for them to navigate to the content they wanted.
After the change, here’s what the metrics looked like:
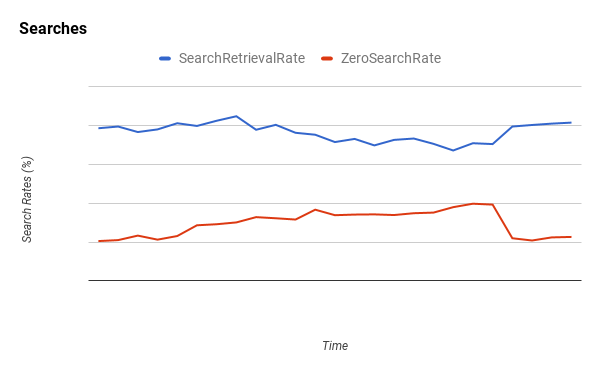
Can you guess where the change took effect? That’s right: where the search retrieval rate and zero search rate both snapped back in the right direction.
You might ask, were the results better for the user? Yes, zero searches went down, but if the results were less specific, how do you know they were any good?
The reason we know the results were helpful is that not only did zero searches go down, but search retrievals also went up. When the users got results based on our new logic, the users retrieved them.
Here’s an example of why data analysis is fun. We figured out what metrics we needed to see whether we were taking care of our users, monitored the metrics for signs of trouble, and jumped on a problem when we found it.
Stay tuned for more Tech Tuesday blogs on the third Tuesday of every month!

About the Author
Charlie Close is a data scientist at Gale and former analyst on Gale’s search engine team. His research includes study of user behavior to improve Gale products.