Gale Analytics: Tip of the Month
| Lisa Novohatski, Marketing Analytics Consultant |
Users of Gale Analytics gain free access to Experian’s Segmentation Portal. When you log in to the Segmentation Portal to learn more about a prominent Mosaic Segment for your library, you’re provided with several hundred data points. It’s important to understand how to interpret the data so you can leverage the information.
For each segment type, you’ll first encounter the summary page.
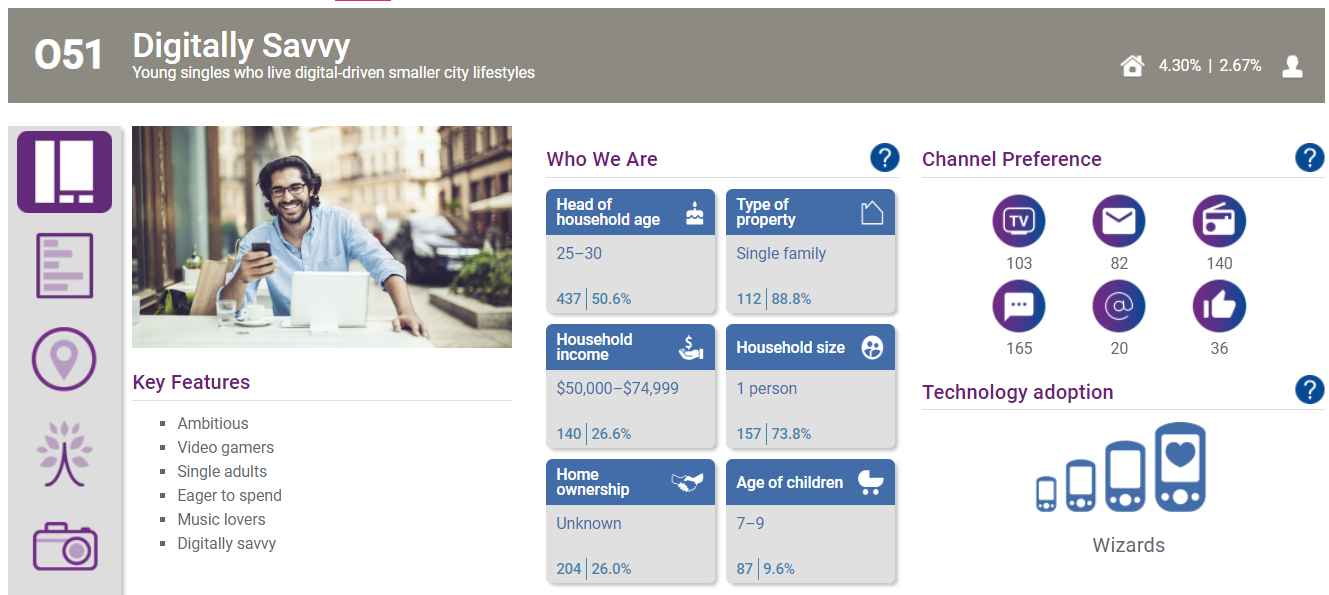
This page gives you the segment name, a short description, and key features.
Let’s take a closer look at the middle panel, titled Who We Are. We will focus on the “Head of household age” tile to understand how to interpret each of the tiles in this panel.
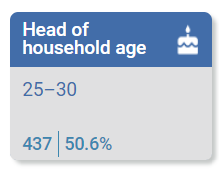
For this Mosaic type, Digital Savvy, the most prominent head of household age bracket is 25‒30 years old. The 50.6% in the bottom left corner represents the percentage of households within this Mosaic Segment that have a head of household age between 25 and 30 years old. The same corner has a value of 453. To interpret this data, you’ll need to understand the relativity index.
Throughout the Segmentation Portal, you’ll see numbers associated with each characteristic provided for the Mosaic Segments. These numbers represent a relative index, allowing you to understand whether a household is likely to exhibit a behavior or to be part of a group and how likely. The index shows how the variable compares with all households in the United States.
An index of 100 is the average, meaning a household in this Experian Mosaic category is just as likely as the average American household to exhibit that behavior or be part of that group. A value below 100 means that this behavior or categorization isn’t likely. A value above 100 means that this behavior or categorization is likely.
The distance from 100 is an indication of depth. The farther the index is from 100, the stronger the indicator. For example, an index of 15 indicates that a household in the Mosaic Segment isn’t likely to exhibit that behavior. An index of 200 indicates that a household in that Mosaic Segment is highly likely to exhibit that behavior, more likely than a behavior with an index value of 150.
We see the relativity indices displayed in the Channel Preference panel on the upper right. This panel displays six of the marketing channels through which households may be receptive to marketing communications.
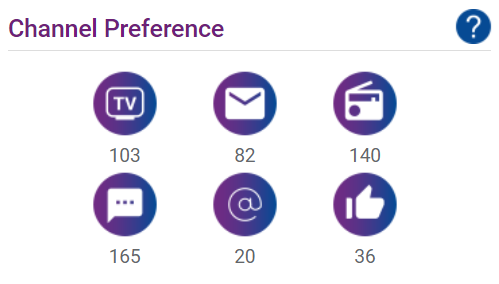
The icons in the first row represent a combination of broadcast and streaming TV, direct mail, and radio. The second row of icons represents mobile SMS, email, and any social media. The number below each icon represents the relativity index for that marketing channel, allowing you to understand whether the Mosaic Segment is receptive to marketing via that marketing channel and also how likely.
In the bottom right corner, there’s a graphic displaying the level of technology adoption for that Mosaic Segment.
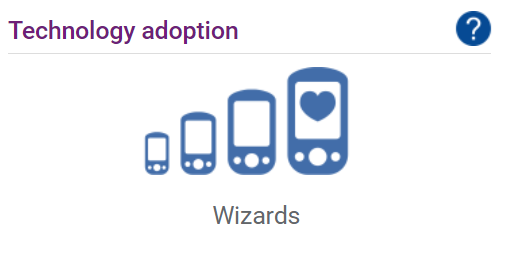
Each Mosaic Segment is categorized as one of four technology adoption categories, with novices as the lowest level of technology adoption, apprentices having low to medium adoption, journeymen having medium to high adoption, and wizards having the highest level of technology adoption.
There’s a lot more data than that too! Please reach out to me if you have any questions about the benefits of Gale Analytics or how other libraries are leveraging their data to gain insight about their community.
M2k Tekno