
| By Heather Hoffman, Digital Content Coordinator, Toledo Lucas County Public Library |
In 2016, the Toledo Lucas County Public Library developed a new strategic plan with three focus areas:
- Support essential literacies
- Foster a culture of innovation and leadership
- Strengthen our community engagement
Strengthening our community engagement had always been a focus for the Library, but now it was solidified in our core. There are two strategies that really stood out under the community engagement focus area:
- Increase the demographic and geographic reach, and the accessibility of the Library’s resources and services
- Create opportunities for strengthened relationships between staff and customers
Knowing the Library was going to make a concerted effort to focus on these strategies, we started evaluating our current analytics product and realized it had limitations. At that time we could only analyze our current patrons, we didn’t have the ability to analyze those in the community we weren’t serving. This is where Analytics on Demand steps in—we take full advantage of the suite of products and reports from the database.
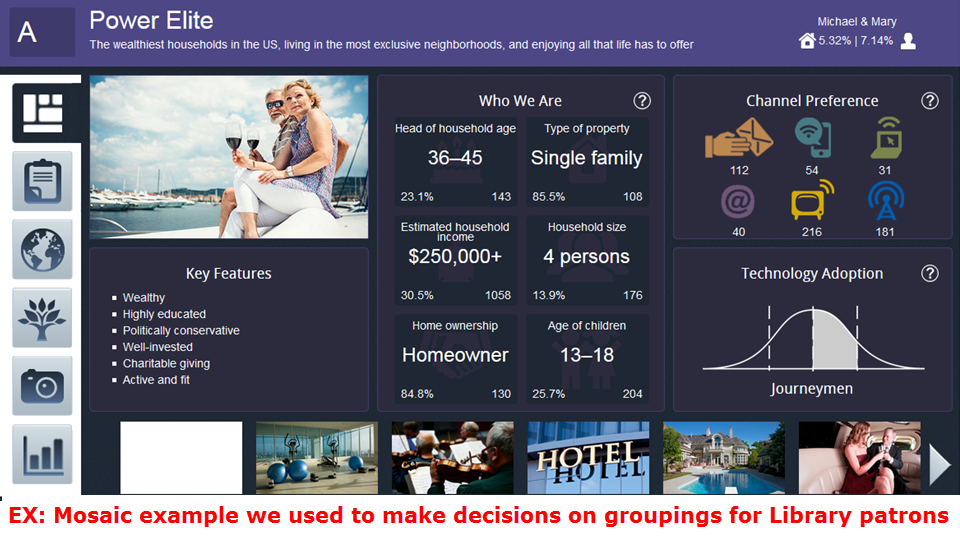
Analytics on Demand has been a huge improvement as far as audience customer tracking for our library system. With our previous analytics tool, we were able to group our customers into 12 categories, some of which had very similar profiles, and all of which offered very few customer details. With Analytics on Demand, there are 71 categories (known as “Mosaics”) that customers are placed in based on their credit card purchases, making for improved overall accuracy. Better yet, these Mosaics offer great detail such as:
- Homeownership & length of residence
- Likelihood of children in the home (and ages of children)
- Marketing channel preference
- Technology adoption
- Head of household age
- Household income
- Hobbies and interests
In fact, the Analytics on Demand Mosaics are so detailed that we ran into a challenge as far as how to track and use all of them in order to engage with our customers.
So, how did we make our decision on what Mosaics to combine and which ones to focus on?
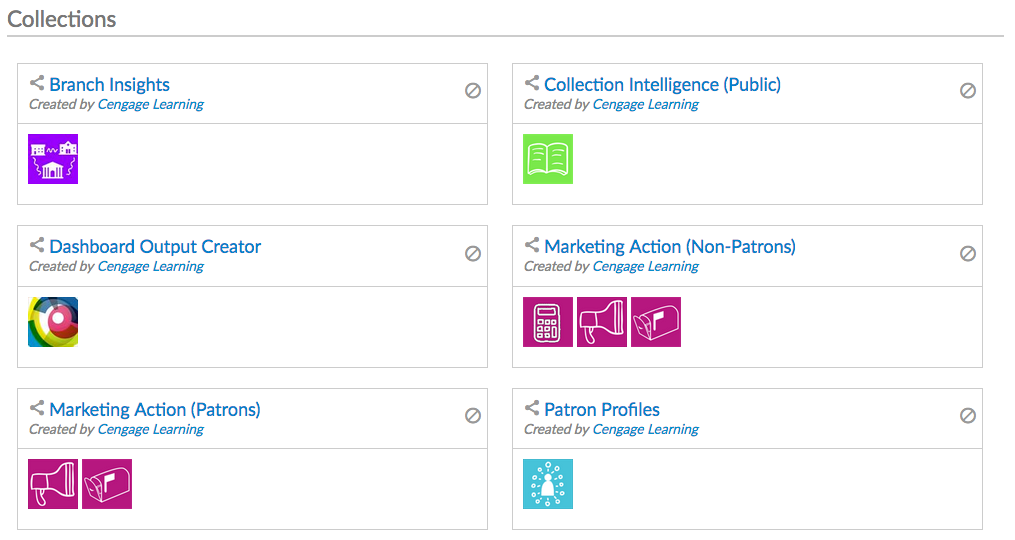
We started by using the branch insights and marketing action reports to help our 20 library locations understand the audience they currently reach as well as the audience they could potentially reach.
Things we were able to gather from these reports included the genre of materials that customers were checking out and what Mosaic categories were most represented in each geographic location. We wanted to perform due diligence and find both high activity and occasional users. We already had assumptions about these details based on our previous analytics tool and historical marketing reports, but we wanted data before we made a decision.
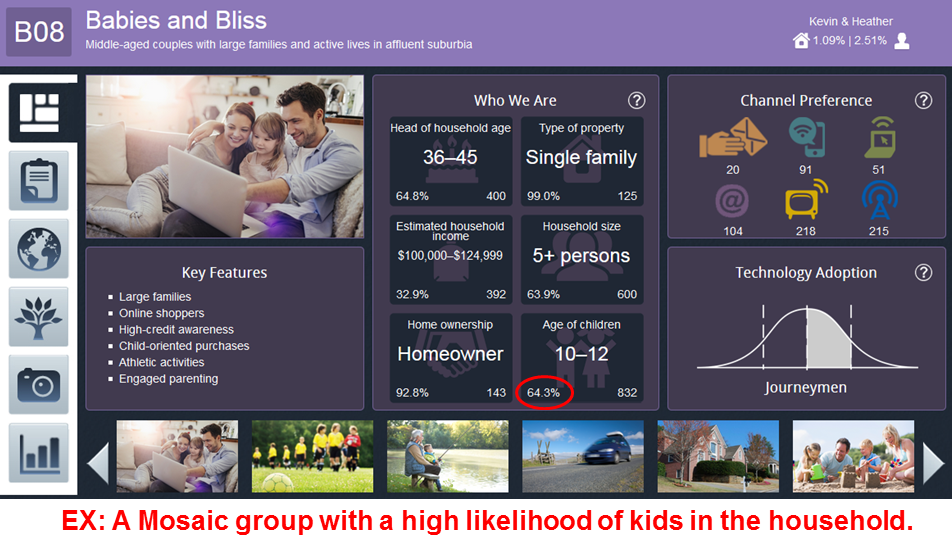
After that, we looked at our current library offerings including services we provide (such as job search and resume help) and programs we offer (such as Storytimes), and grouped the Mosaics into 13 categories that fit our offerings. For example, three of the categories we created were: Parents of babies and toddlers, parents of children, and parents of teens/tweens. To get these groupings, we took the Mosaics that showed a high likelihood of households with minors in those age categories.
Now that we’ve looked at our customers and identified our customer categories, we are using the Analytics on Demand Mosaic profiles to market to customers in the way that they prefer. For example, we discovered that our senior customers prefer print marketing at a rate of 3.5 times that of any other medium, so we are focusing our efforts on creating print materials for them as well as investing in print advertisements.

Likewise, for the “Parents of Teens & Tweens” group, we saw that customers preferred email marketing. Therefore, we are creating targeted emails, advertising offerings for teens such as our FINRA Thinking Money Exhibit.
In all, Analytics on Demand is an amazing analytics tool for organizations wishing to invest in a highly customizable product that offers a wealth of customer information. It’s a great tool for large library systems in particular, whose audience can be greatly varied from location to location.
Interested in learning more about Analytics on Demand? It’s easy! Simply request a demo or speak to a Gale rep.
About the Author
Heather Hoffman is the Digital Content Coordinator at TLCPL. She’s stepped on the scale enough times to say unequivocally, that numbers don’t lie…and therefore invests much of her time in using numbers and analytics to help the Library succeed in its various marketing endeavors.