Gale Analytics: Tip of the Month
| By Lisa Novohatski, Analytics Consultant |
The Experian Mosaic Segmentation Portal has been updated! To access the new portal, Gale Analytics users can still log in at the same URL, but it will display the fresh, new Segmentation Portal.

While there are many tools available through this portal allowing you to interact with the Experian Mosaic Segmentation Model, today’s tip will focus on the Understand tool, which most closely mirrors the former Segmentation Portal. Selecting “Understand” in the top left corner will bring you to a page that looks similar to the former Segmentation Portal. Here, you can choose a group or a type that you’d like to learn more about.
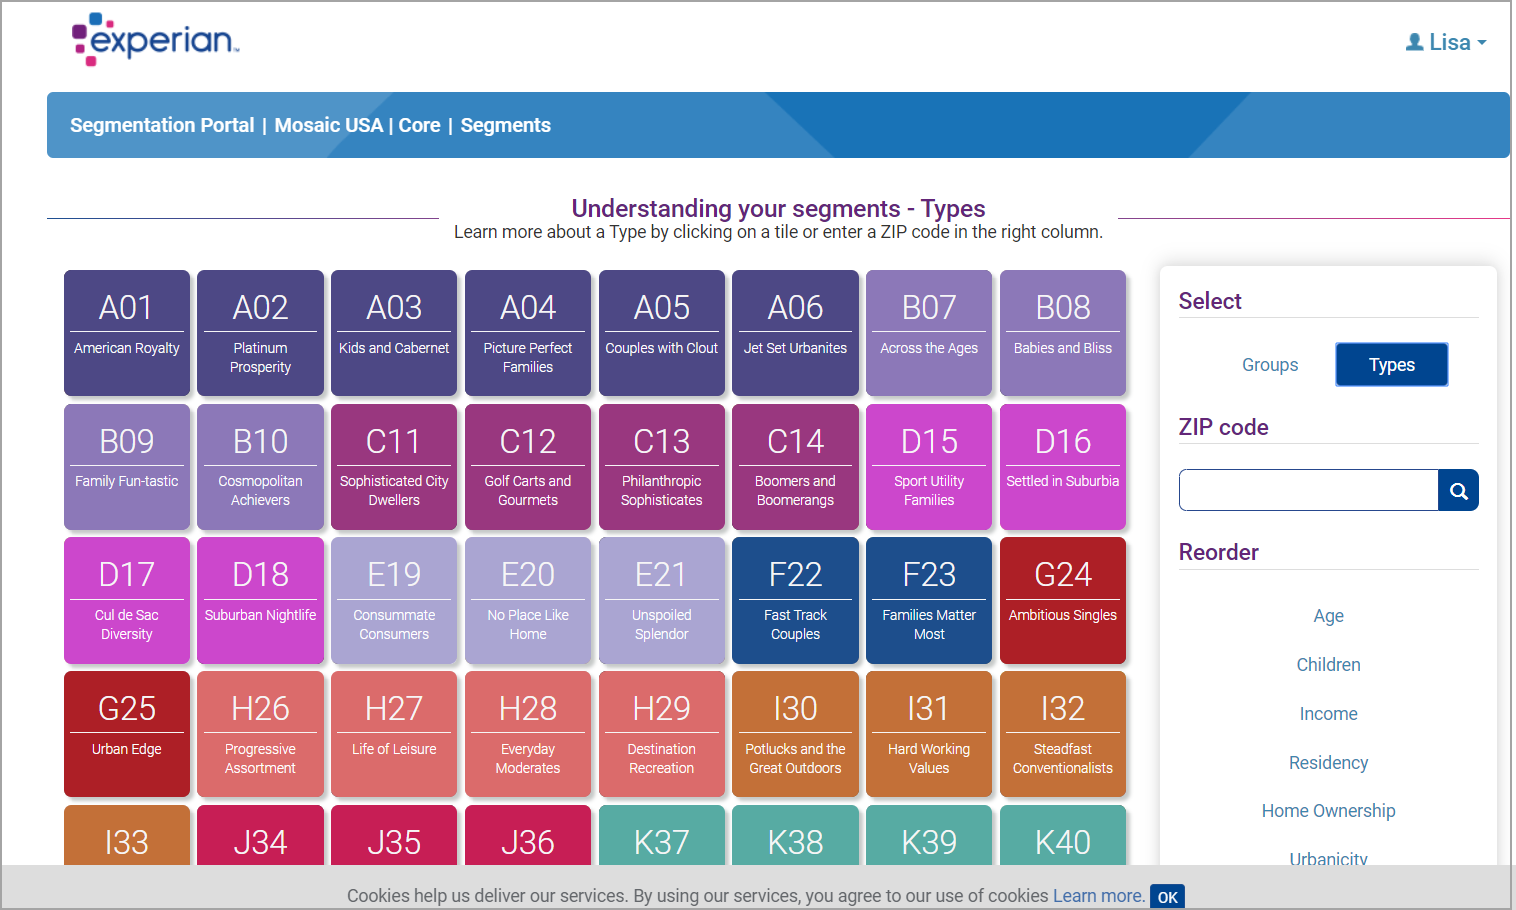
Some of these Mosaic Segments may look familiar to you, though some will be new. In the process of updating the portal, Experian also updated the Mosaic Segmentation Model. There are still 71 Mosaic Segments, but the segments have been revisited and revised to more accurately represent the households characterized into each segment.
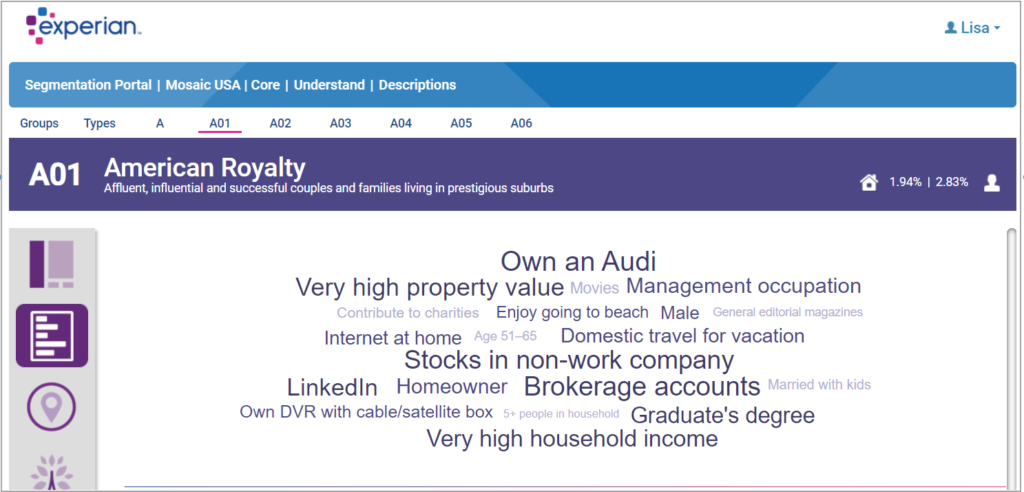
Selecting a segment, for example American Royalty, will bring you to a summary page for that segment that looks similar to the previous Segmentation Portal.
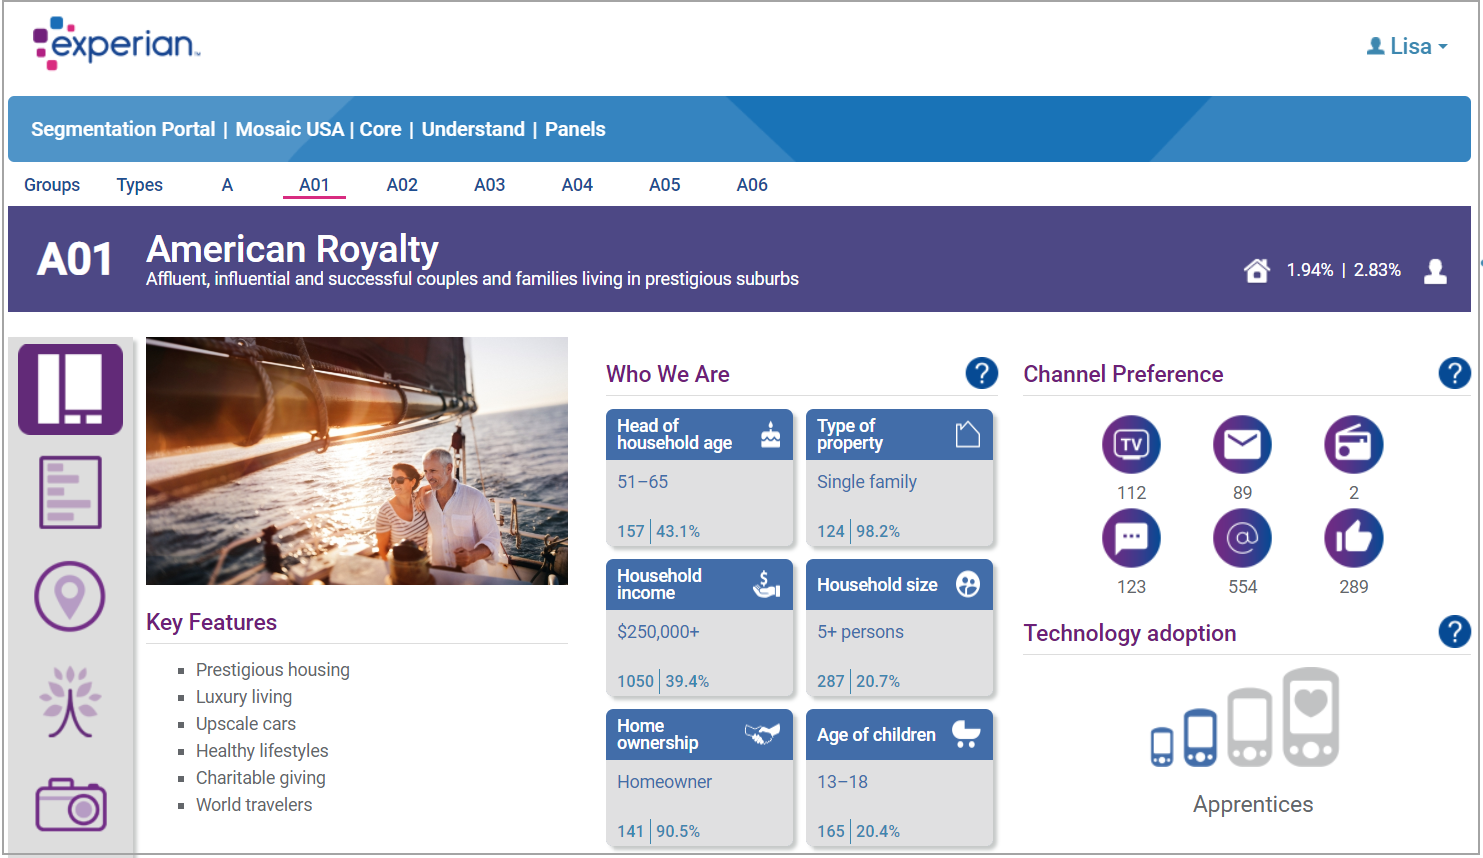
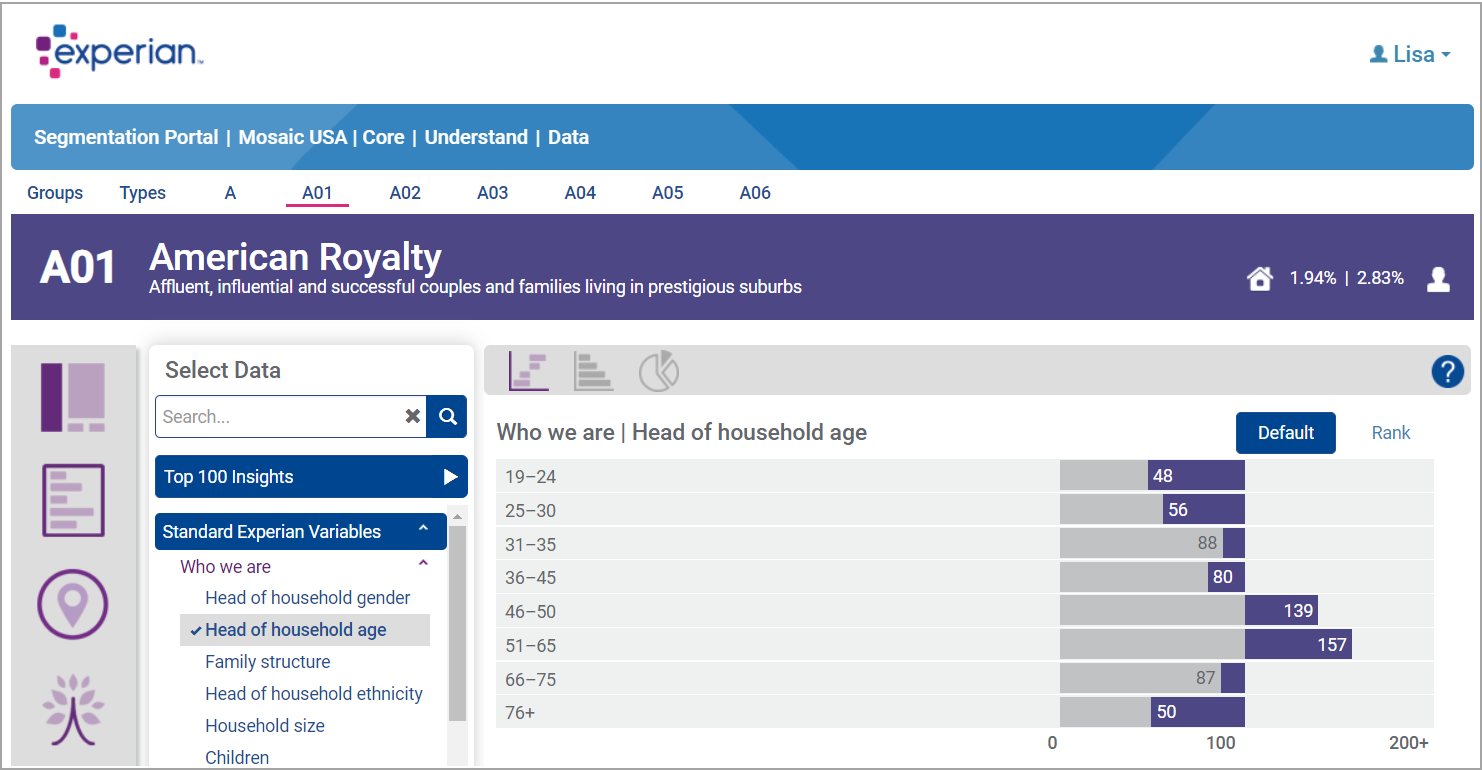
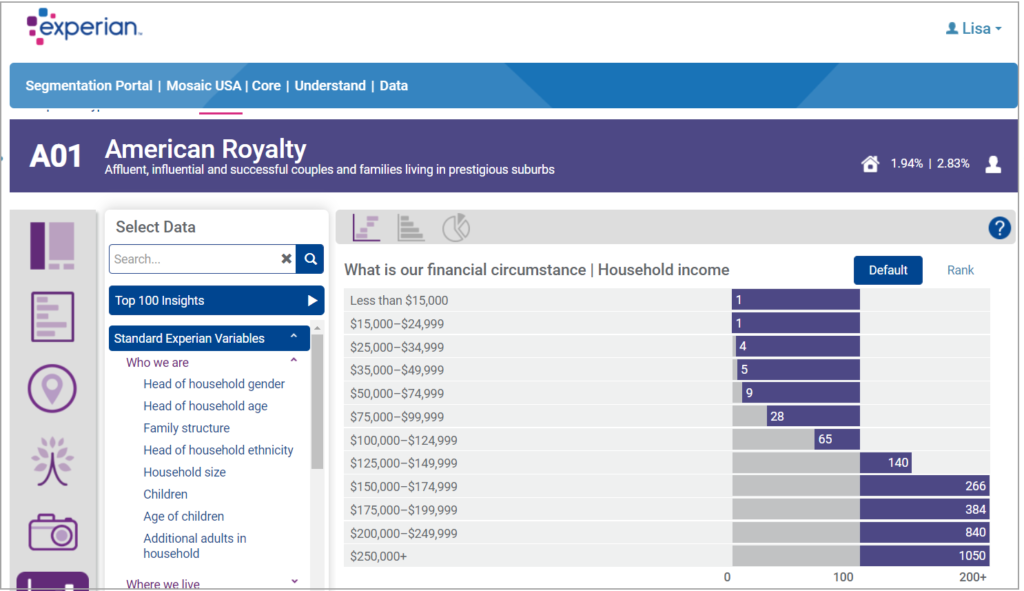
There is added functionality to the portal, making it more interactive and easier to use. Choosing any of the boxes in the “Who We Are” panel in the above example brings you directly to the data. For example, if you select the “Head of household age” box in the upper left-hand corner of the “Who We Are” panel, you’ll be directed to the breakdown of age categories for this Mosaic Segment.
In the left navigation, you’ll see a number of icons similar to the previous version of the Segmentation Portal. Choosing the second icon in the left navigation, as in the previous portal, brings you to a body of text that describes this segment. At the top of this page, there’s a word cloud displaying some prominent characteristics that define that Mosaic Segment. This word cloud is now interactive—selecting any of the terms brings you directly to the data so you can get more information on that characteristic. For example, choosing “Very high household income” on the bottom of the graphic brings us to the full distribution of income brackets.
That’s all for now. There are many things for us to explore in the new Segmentation Portal—stay tuned for future tips as we cover more of these changes and upgrades. As always, please reach out to me if you have any questions about Gale Analytics.
Air Jordan