| By Lisa Novohatski, Marketing Analytics Consultant |
The Experian Mosaic® Segmentation model leveraged in Gale Analytics provides users with a wealth of information on the lifestyles and behaviors of patrons and nonpatrons within their community. More granular information on each Mosaic segment can be found in the Experian Segmentation Portal, unlocking insights about American households that can be leveraged by libraries in a variety of ways:
- Inform collection development by understanding reading behaviors and content of interest.
- Inform community partnerships by learning what your patrons like to do outside the library.
- Help inform a fundraising campaign by understanding patron and nonpatron contribution behaviors.
Let’s look at the last example. Library advocates aren’t always library patrons—there are many members of the community who continually support the library without actively using services or offerings. When planning a fundraising campaign, it would be beneficial to the library to include all relevant community members, whether they’re patrons or not. Gale Analytics: Community Insights provides you with Experian Mosaic Segmentation information for all households in the designated service area—patrons and nonpatrons. The first step in planning a fundraising campaign is to identify the households most likely to contribute.
Step 1: Identify Households Likely to Support the Library
For each Mosaic segment, we can see the likelihood that member households contribute to different types of organizations.
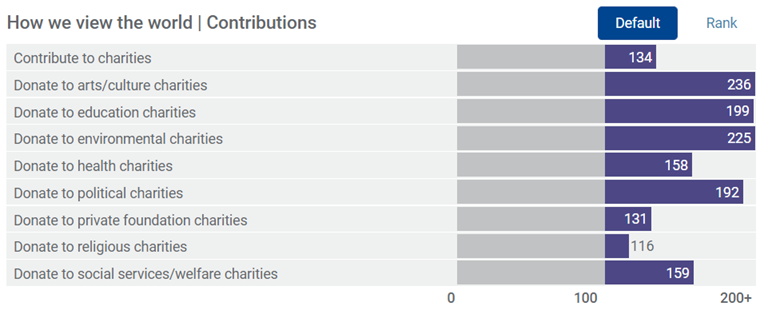
The example above depicts the contribution likelihood for one Mosaic segment, American Royalty. We see information on how likely households in this segment are to contribute to any charity, and then more granular information on the likelihood of contributing to different types of charities. This view allows us to see this information at the segment level, showing all contribution information for one segment.
We can also view the data differently—understanding which of the 71 Mosaic segments are most likely to contribute either to any charity or to any specific type of charity. Within the portal, selecting the data point of interest (for example, “Donate to education charities”) will provide a visualization of the likelihood indices of all 71 segments for that data point.
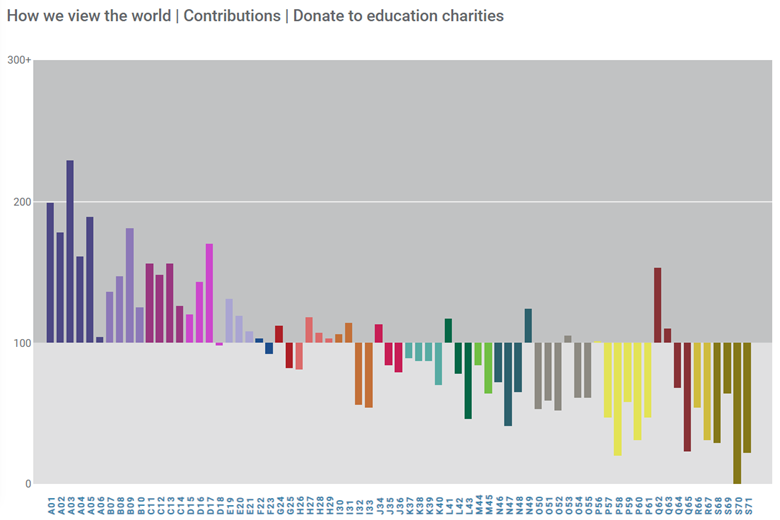
With this visualization, we see that there’s a wide range of likelihood to donate to education charities. It’s clear, however, that there are a number of Mosaic segments that are likely to donate to education charities, and we can identify them by the height and placement of their corresponding column.
You can also use the Audience tool built into the Experian Segmentation Portal. This tool allows you to select criteria of interest in order to identify the Mosaic segments that mostly closely match your criteria. Once you’re in the tool, you can identify the Mosaic segments most likely to contribute to education charities by selecting this criteria and either viewing the Quick Stats or running a report. Viewing the Quick Stats will rank order the Mosaic segments based on their similarity score to the selected criteria.

Similarly, running a report will also rank order Mosaic segments based on the similarity score to the selected criteria. The generated report will provide more detailed information on the individual segments that meet the selected criteria.
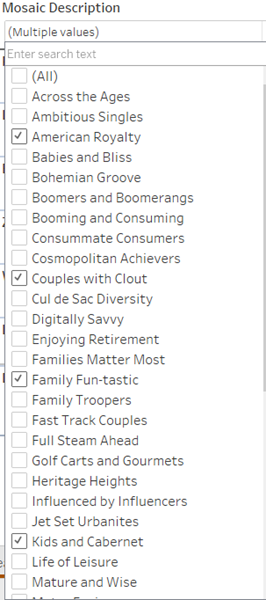
Step 2: Use Gale Analytics to Build Segments
Once you’ve identified the Mosaic segments most likely to contribute, you can use the Gale Analytics dashboard to start building a targeted marketing campaign. This is the easy part! Use the built-in filters to isolate these segments in the dashboard.
Selecting these Mosaic segments will limit the analysis in the Community Insights Dashboard to include only the households that fall into the selected segments. You can examine their demographics to learn more about these households in the Patron Measures tab; see where they cluster in the service area to inform outreach efforts on the maps; or export an email or direct mail campaign list in the Mailing List tab.
That’s all for now. As always, please reach out to me if you have any questions about Gale Analytics.
shock drop air force 1 full uv reactive | Adidas Yeezy Boost 350 V2 – Core Black Red — Ietp – white yeezy shoes for kids boys girls dresses sale