
New Enhancements Simplify User Dashboards
| By Gale Staff |
The Gale Analytics team listened to your feedback and has made enhancements to Tableau Reader dashboards. Check out these helpful upgrades:
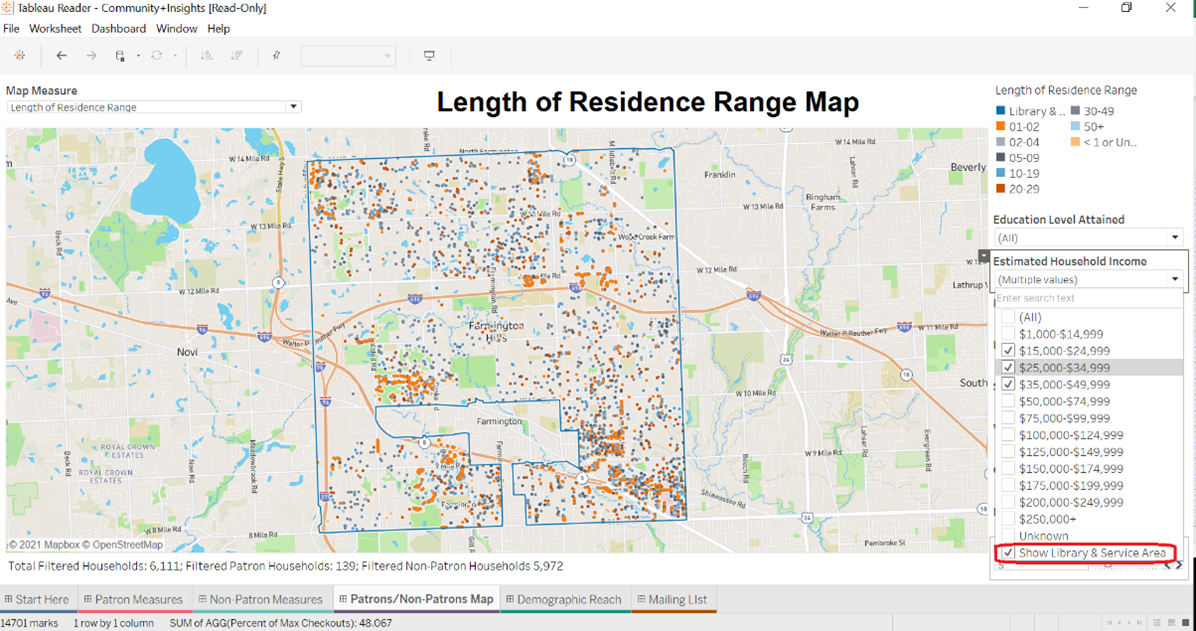
- Increased visibility of your service-area boundary. See where your patron and nonpatron activities and household characteristics are clustered within your service area to uncover new opportunities for outreach. Boundary can be turned on or off in each filter.
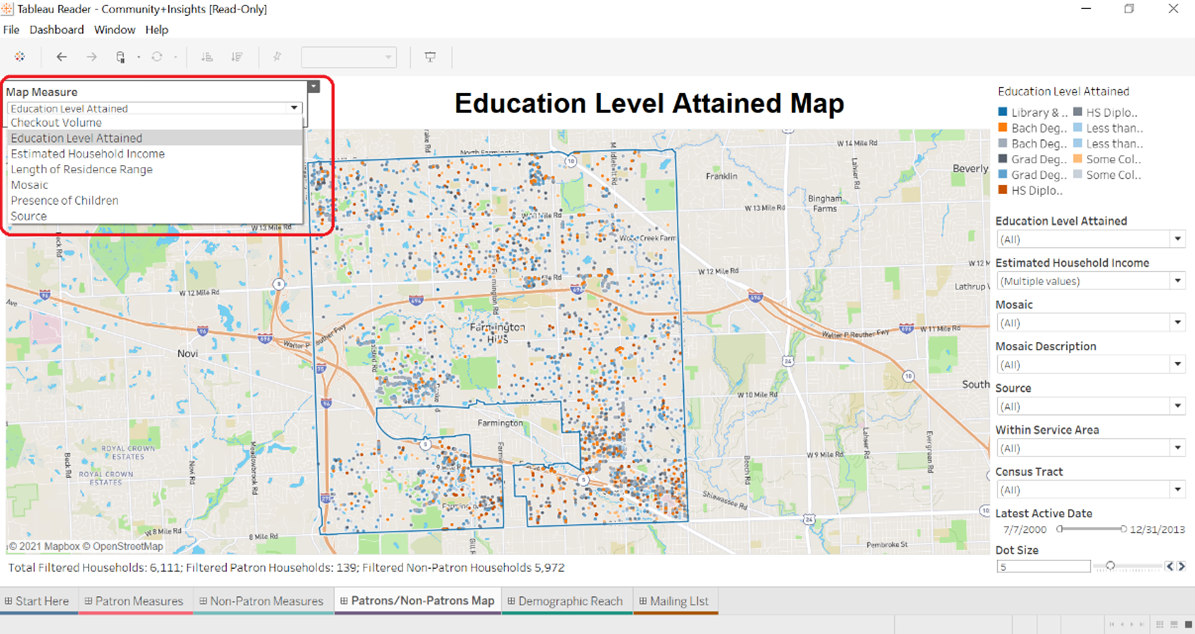
- Additional map measures. Consolidating map tabs into a single Map Measure menu unclutters the Tableau workbook, improves system performance, and allows you to view more measures. In addition to checkout volume, presence of children, and estimated household income, you’ll now see these variables on the map:
- Educational attainment
- Mosaic® segmentation cluster
- Length of residence range
- Patron(/Nonpatron)
- Library marker. Library location can be viewed on the map. To locate your library dot, right-click on the Library & Service Area variable in the upper-right legend and select Highlight Selected Items.

- New census-tract filters. Census tracts are a popular way to build branch service areas. Now you can filter by census tract and persist those areas across each Gale Analytics Workbook tab.

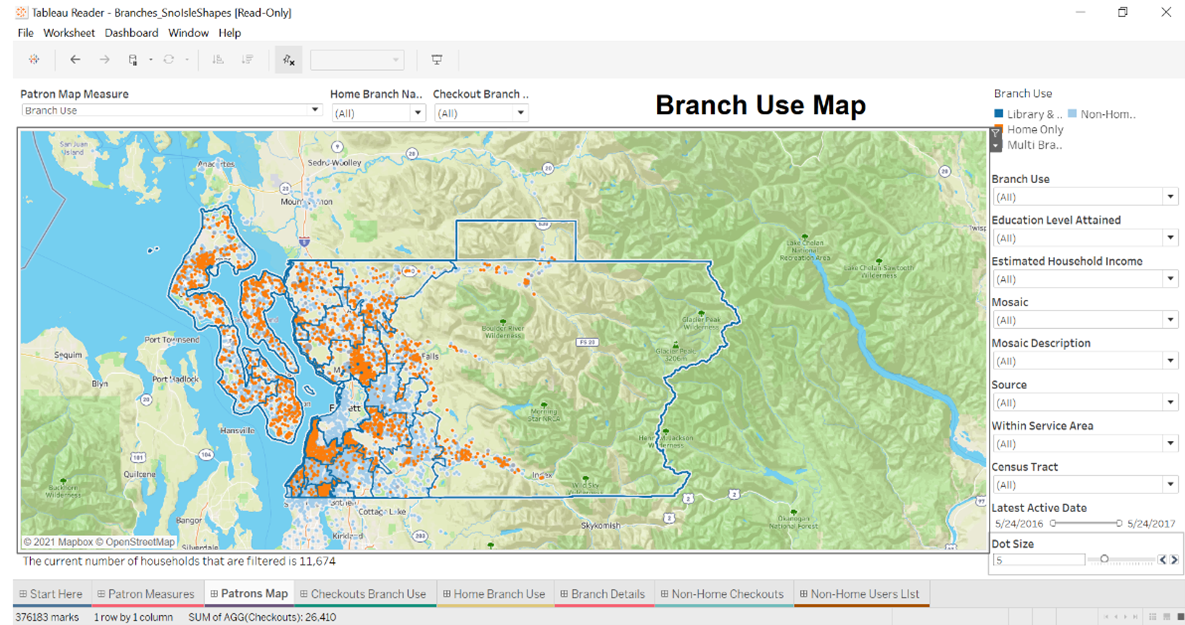
- Branches dashboard ability to ingest shape files. Define branch service areas more precisely in the Branches dashboard by uploading a custom KML file.
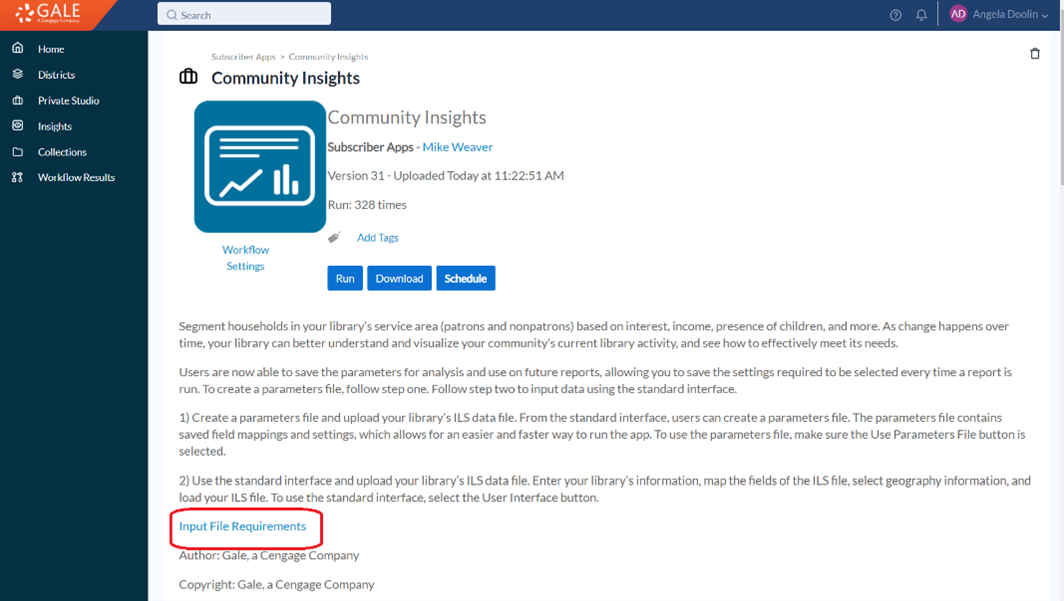
- In-app documentation. A link to the Gale Analytics “Input File Requirements” document is available on each dashboard description page.
To request more information or a demo of this enhancement, please reach out to our data experts.
boohoo , Womens & Mens Clothes , Shop Online Fashion | cool white nike sneakers for women black – Off – White x Air Jordan 1 NRG UNC The Ten — Kick Engagement